Undervalued Dividend Aristocrats
I rank 64 of the Dividend Aristocrats by quality score and identify undervalued stocks for further research and investment.

The S&P 500 Dividend Aristocrats Index contains 67 dividend growth [DG] stocks called the Dividend Aristocrats. With a few exceptions, the Dividend Aristocrats are S&P 500 companies with higher dividend payouts every year for 25 or more years.
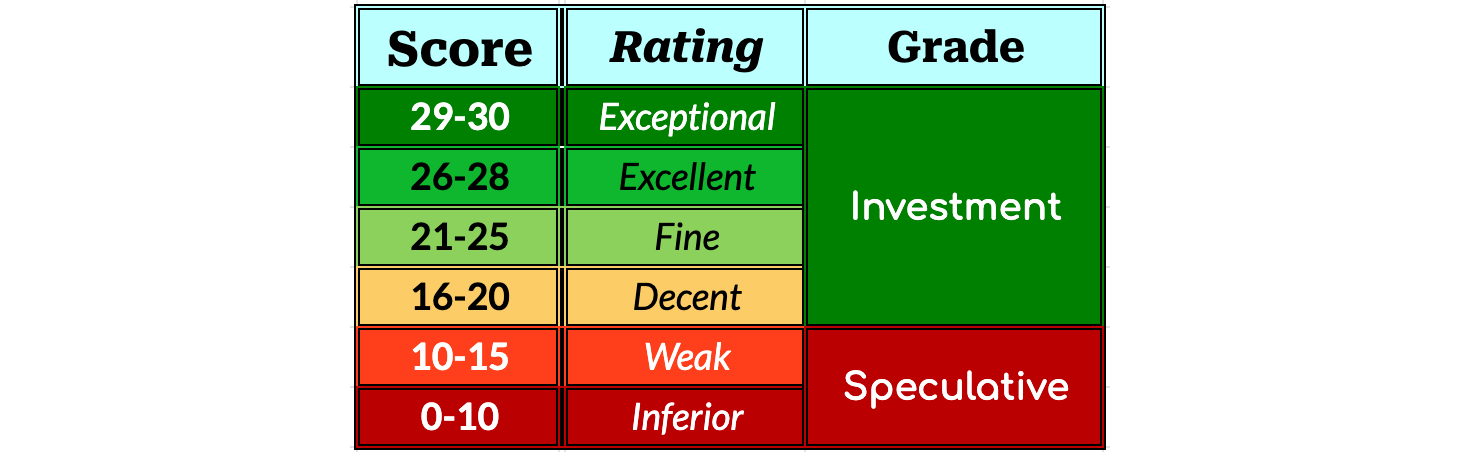
Based on their quality scores, I rate stocks as Exceptional (29-30), Excellent (26-28), Fine (21-25), Decent (16-20), Poor (11-15), and Inferior (0-10). Investment Grade ratings have quality scores in the range of 16-30, while Speculative Grade ratings have quality scores below 16 points.
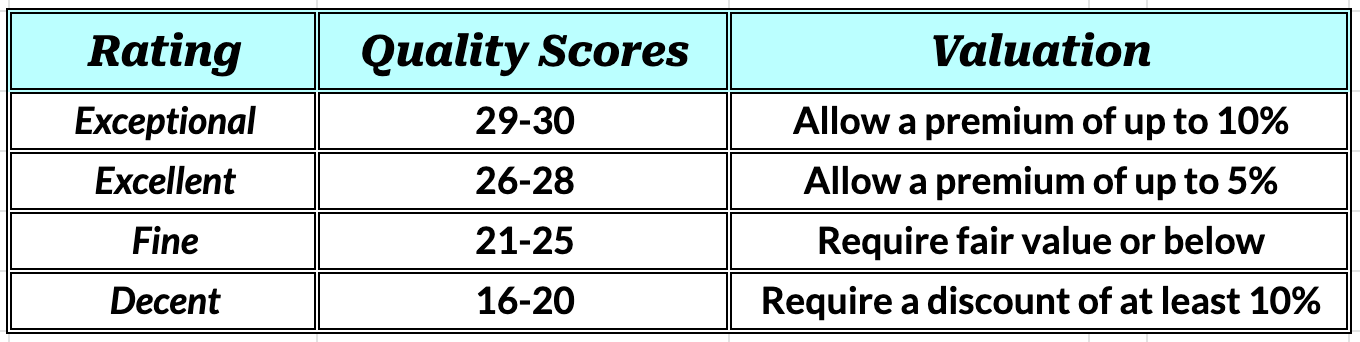
To determine if stocks are undervalued, I use three valuation screens:
- Forward dividend yield > 5-year average dividend yield
- Stock price < Fair Value estimate
- Stock price < risk-adjusted Buy Below price
I use a survey approach to estimate fair value, referencing fair value estimates and price targets from several online sources, including Portfolio Insight, Morningstar, and Finbox. Additionally, I estimate fair value using the 5-year average dividend yield of each stock using data from Portfolio Insight. With several estimates and targets available, I ignore the outliers (the lowest and highest values) and use the average of the median and mean of the remaining values as my fair value estimate.
Below, I provide quality scores, key metrics, and valuations of the Dividend Aristocrats. Accompanying the article is a downloadable spreadsheet with fundamental and added-value data of the Dividend Aristocrats covered in this article.
This article updates one published in February and uses a similar layout and descriptions.
About the Dividend Aristocrats
The S&P 500 Dividend Aristocrats Index is a list of 67 companies in the S&P 500, most of which have paid higher dividends every year for at least 25 consecutive years. I'll highlight some exceptions below. Only regular cash dividends are considered.
To be eligible for inclusion in the S&P 500 Dividend Aristocrats Index, a stock must be a member of the S&P 500 and have increased dividend payouts for at least 25 consecutive years. Additionally, its market capitalization must be at least US$3 billion, and its average daily value traded must be at least US$5 million for the three months before the rebalancing reference date.
Diversification criteria and special rules for spin-offs, mergers, and acquisitions may affect the constitution of the index. For details, see this document covering the S&P Dividend Aristocrats Indices Methodology.
The S&P 500 Dividend Aristocrats have delivered higher risk-adjusted returns than the broader S&P 500, exhibiting capital growth and dividend income characteristics.
Quality Assessment
There are many ways to define dividend quality. I like using independent quality indicators from trusted information sources, similar to David van Knapp's Quality Snapshots.
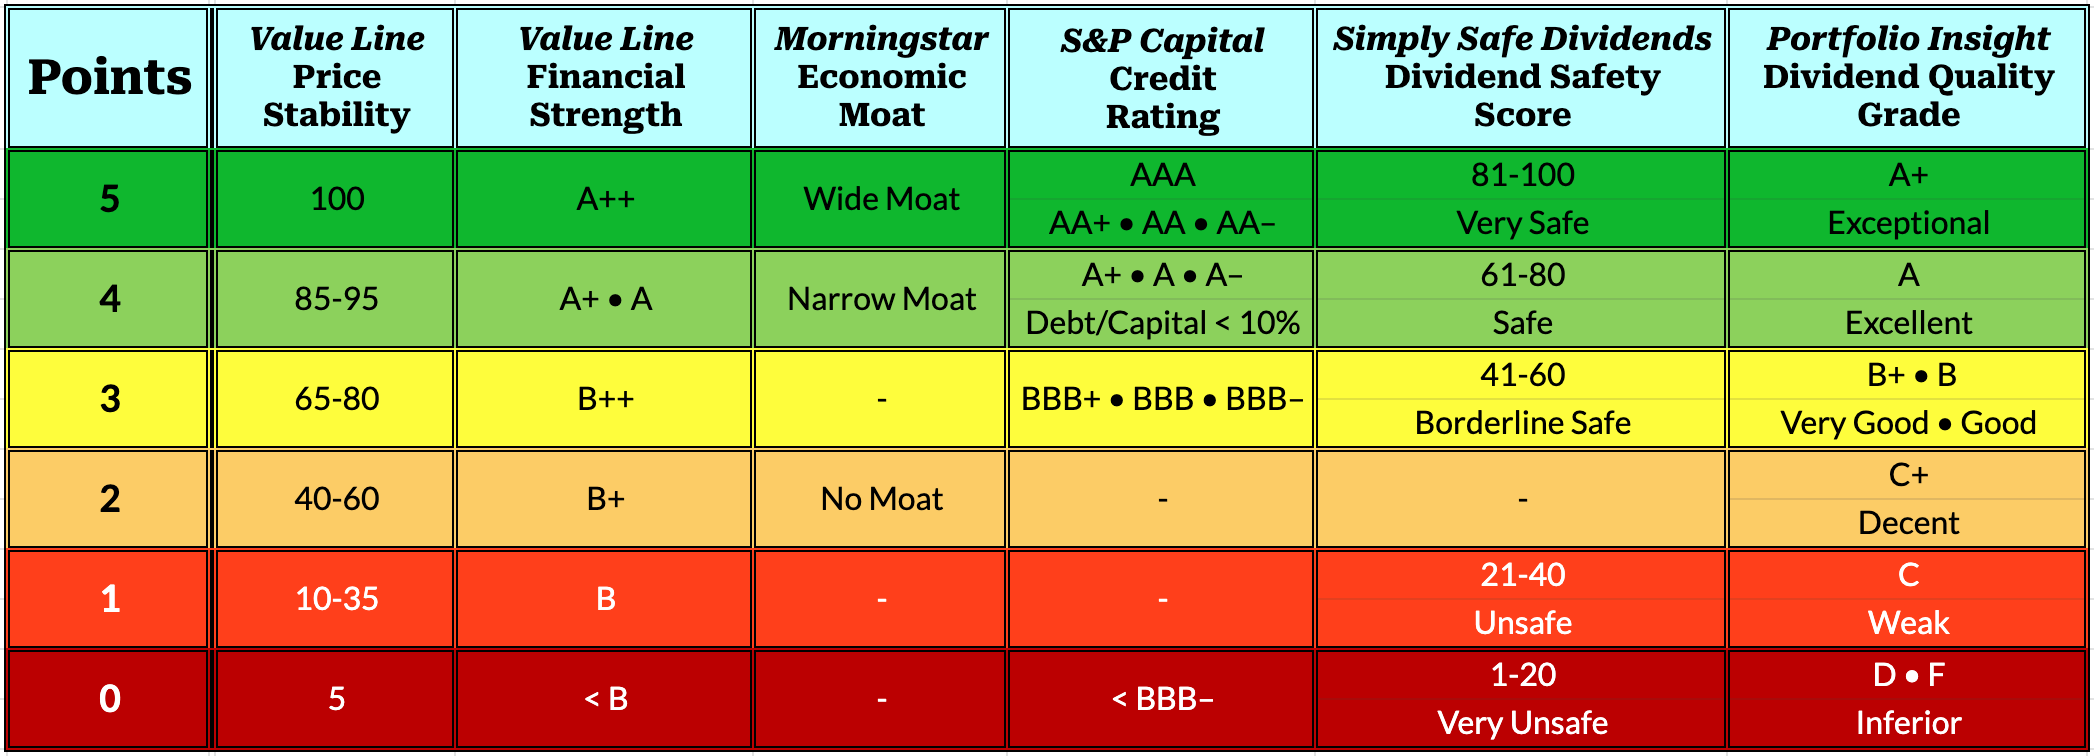
I reference six quality indicators and assign 0-5 points per indicator for a maximum quality score of 30. Here's how I rate stocks and differentiate between Investment and Speculative grades:
Here are the six quality indicators:
- Value Line [VL] Price Stability score
- Value Line [VL] Financial Strength rating
- Morningstar [MS] Economic Moat
- S&P Global [SP] Credit Ratings
- Simply Safe Dividends [SS] Dividend Safety Scores
- Portfolio Insight [PI] Dividend Quality Grade
The Price Stability score is based on a ranking of the standard deviation of weekly percent changes in the price of a stock over the last five years. VL presents the score on a scale of 100 (highest) to 5 (lowest) in increments of 5. A stock that fluctuates widely around its long-term trend line is riskier. As a long-term investor, I prefer stocks with stable price action and consistent growth.
The Financial Strength rating measures a company's financial condition. It is reported on a scale of A++ to C. VL considers fundamentals such as net income, cash flow, debt to equity, profit outlook, industry stability, and company return to assign ratings. Ratings of B or B+ are considered average. The lowest rating of C is reserved for companies in severe financial difficulty.
The Economic Moat is a proprietary data point from MS that reflects a company's sustainable competitive advantage. A company with a wide economic moat can fend off competition and earn high returns on capital for at least 20 years, whereas a narrow-moat company can do so for at least ten years. A no-moat company has either no advantage or one that will quickly dissipate.
The Credit Ratings from SP are forward-looking opinions about the ability and willingness of debt issuers to meet their financial obligations on time and in full. Credit ratings address creditworthiness rather than investment merit. The rating scale ranges from AAA to D, with BBB- and higher considered investment grade ratings, and BB+ and lower regarded as speculative grade.
The Dividend Safety Scores predict dividend risk over a complete economic cycle. SS determines scores based on an analysis of dividend-related metrics, including payout ratios, debt levels, recession performance, dividend longevity, industry cyclicality, free cash flow, and analyst estimates. Scores range from 0 to 100.
With the Dividend Quality Grade, PI differentiates between companies likely to increase their dividend during the next 12 months and companies at risk of freezing or cutting their dividends. Grades range from A+ to F, with F indicating companies at significant risk of cutting their dividends. PI considers earnings, revenue, dividend performance, and performance and financial strength metrics to assign the grades.
How I Rank Stocks
To rank stocks, I sort them by quality score and break ties by considering up to three factors in turn:
- Simply Safe Dividends Dividend Safety Scores
- S&P Global Credit Ratings
- Forward Dividend Yield
When two stocks with the same quality score have the same Dividend Safety Score, I compare their Credit Ratings, ranking the one with the better Credit Rating higher. I rarely need to break ties with the Forward Dividend Yield.
Compelling Metrics
I consider several metrics when evaluating DG stocks. These metrics help me identify DG stocks with superior growth and income outlooks and stocks with a strong recent performance. Such stocks may have the momentum to propel future performance.
Projected Dividend Growth Rate
The 5-year dividend growth rate [5-DGR] is a trailing growth rate metric. While some analysts use the 5-DGR to project future dividend growth, there is no guarantee that a company will maintain that growth rate.
I use two additional metrics to predict future growth: the 5-year EPS growth rate [5-EGR] and the 5-year revenue growth rate [5-RGR]. These metrics provide additional hints of future growth prospects as companies pay dividends from earnings, and earnings depend on revenue.
Conservatively, I ignore the maximum of the three growth rates and average the lower pair, further limiting the projected dividend growth rate [Proj-DGR] to 30%:
where:
• D = 5-DGR
• E = 5-EGR
• R = 5=RGR
I present the Proj-DGR adjacent to the 5-DGR in the tables below.
Adjusted Chowder Number
The Chowder Rule favors DG stocks likely to produce annualized total returns of at least 8%. Traditionally, the Chowder Rule is implemented by adding a stock's forward dividend yield and 5-DGR to obtain the Chowder Number [CN].
Chowder required a margin of safety based on yield and whether the stock is a utility stock or not:
- Stocks yielding less than 3% require a CN of at least 15%.
- Stocks yielding at least 3% require a CN of at least 12%.
- Utility stocks yielding at least 4% require a CN of at least 8%.
Higher-yielding utility stocks get special treatment because utilities are regulated and enjoy regional competitive advantages. As a result, utilities have relatively stable yields and growth rates.
Instead of using the 5-DGR to implement the Chowder Rule, I use the Proj-DGR and calculate the Adjusted Chowder Number [ACN] as follows:
where:
• Y = forward dividend yield
I cap the forward dividend to 10%. (I am suspicious of yields above 10%).
In tables showing the ACN, I color-code cells based on the likelihood that the stock will deliver annualized returns of 8% or more:
- green indicates stocks likely to deliver annualized returns of 8%
- yellow indicates stocks less likely to deliver annualized returns of 8%
- red indicates stocks unlikely to deliver annualized returns of 8%
Color-coding the ACN column is a visual aid, though only stocks with green cells in the ACN column abide by the Chowder Rule and have favorable ACNs.
Here are the thresholds I use for color-coding:
- Stocks yielding less than 3%: red < 10 ≤ yellow < 15 ≤ green
- Stocks yielding at least 3%: red < 8 ≤ yellow < 12≤ green
- Utility stocks yielding at least 4%: red < 5 ≤ yellow < 10 ≤ green
When considering new positions for my DivGro portfolio, I prefer candidates with favorable ACNs (those color-coded green).
Projected 5-Year Yield on Cost
The projected 5-year yield on cost [5-YOC] is an income-oriented metric indicating the projected yield on cost after buying and holding a stock for five years.
To calculate the 5-YOC, I use the stock's forward dividend yield and projected dividend growth rate:
where:
• Y = forward dividend yield
• ^5 means to the 5th power
As mentioned earlier, I cap the forward dividend yield to 10%.
5-year Trailing Total Returns
I include Portfolio Insights' 5-year trailing total returns [5-TTR] in the tables below. This metric adds the returns due to stock price appreciation (or depreciation) and dividend payments over the trailing 5-year period.
Determining trailing dividends is done by grouping dividend payments by ex-date into trailing twelve-month periods, split-adjusting the dividend payments where needed, and then performing the compound annual growth rate calculations.
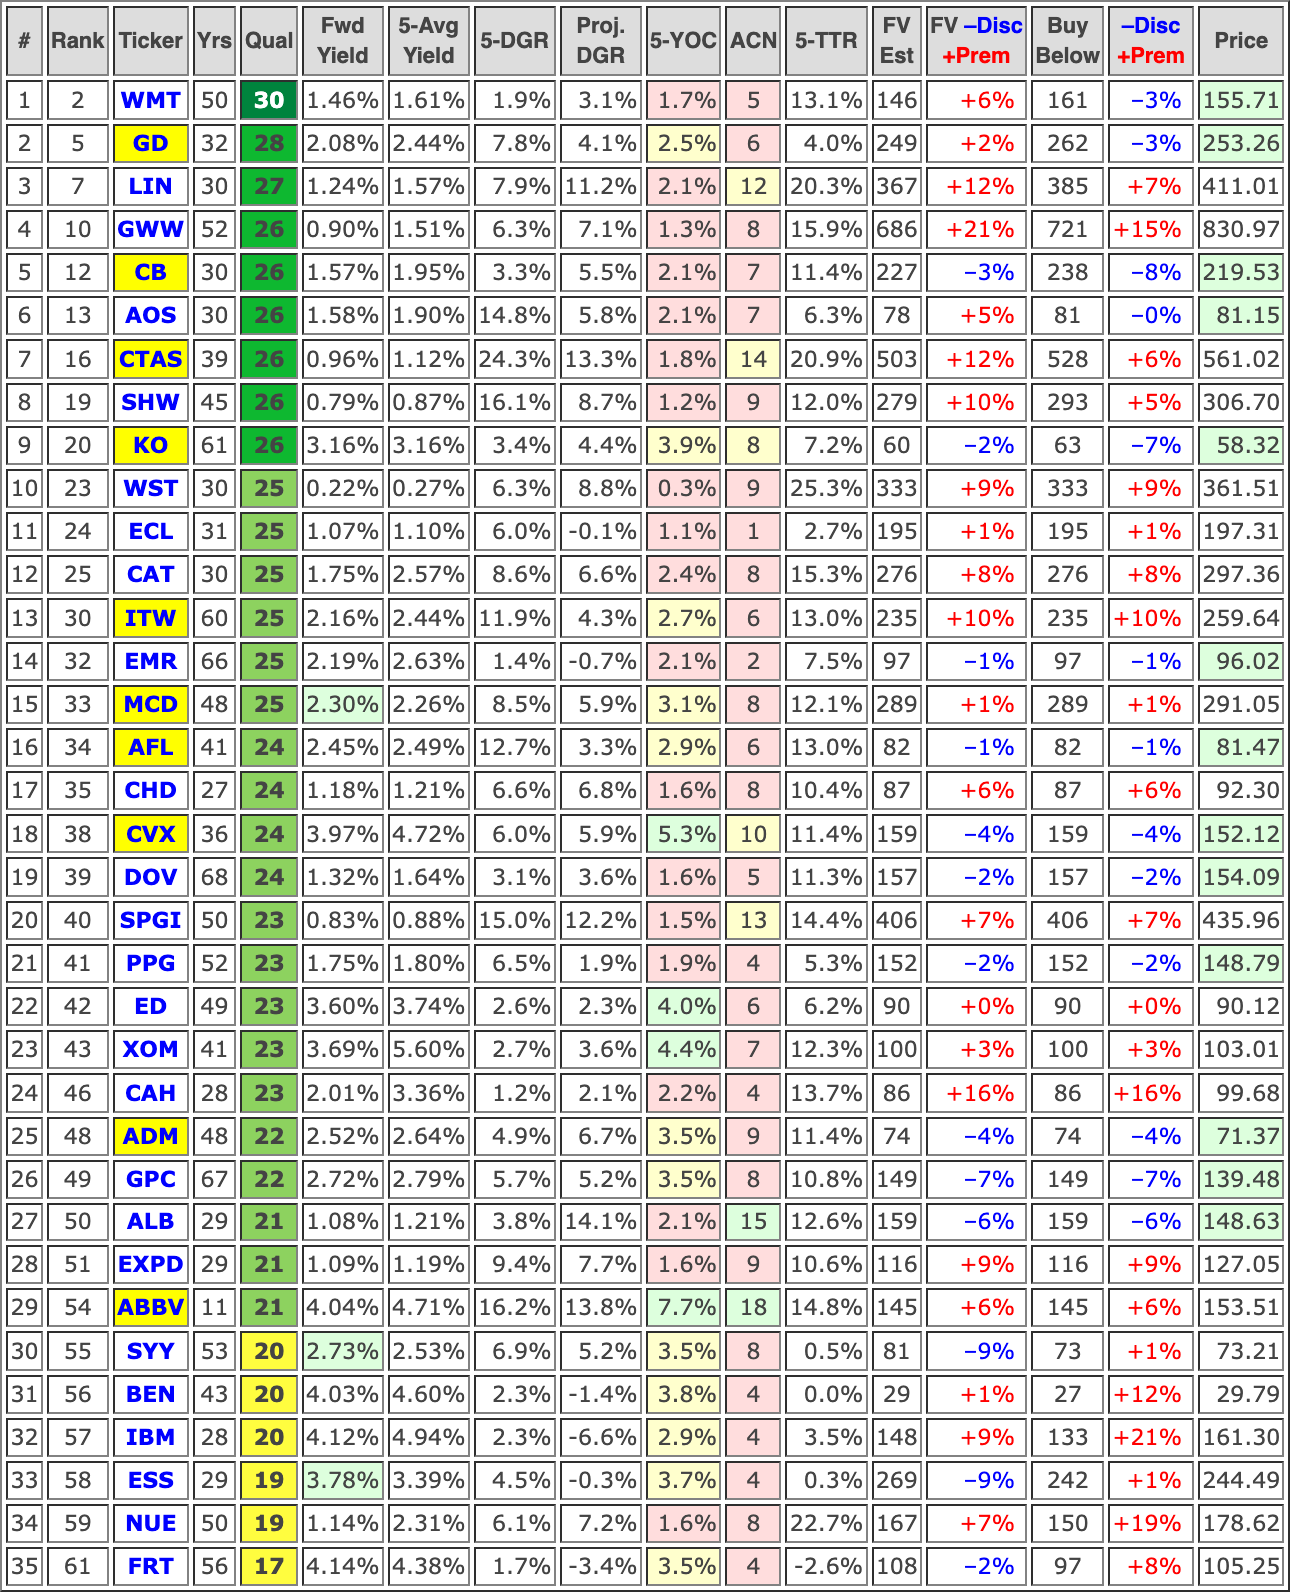
Key Metrics and Valuation
The following sections present the Dividend Aristocrats ranked by quality score.
Each table below presents quality scores, key metrics, and my Fair Value estimate and risk-adjusted Buy Below prices:
Key to Table Headings and Cell Coloring
- Yrs: years of consecutive dividend increases
- Qual: Quality score out of 30
- Fwd Yield: forward dividend yield for a recent share Price
- 5-Avg Yield: 5-year average dividend yield
- 5-DGR: 5-year compound annual growth rate of the dividend
- Proj DGR: projected dividend growth rate
- 5-YOC: the projected yield on cost after five years of investment
- ACN: Adjusted Chowder Number
- 5-TTR: 5-year compound trailing total returns
- FV Est: my fair value estimate
- FV –Disc +Prem: discount or premium of the recent share Price to my FV Est
- Buy Below: my risk-adjusted buy-below price
- –Disc +Prem: discount or premium of the recent share Price to my Buy Below
- Price: recent share price
Color-coding
- Ticker: highlighted for stocks I own in my DivGro portfolio
- Fwd Yield: green if Fwd Yield ≥ 5-Avg Yield
- 5-YOC: green if 5-YOC ≥ 4.0%, yellow if 5-YOC ≥ 2.5% (but less than 4.0%), and red if 5-YOC < 2.5%
- ACN: colored based on the likelihood of annualized returns of 8%, according to the Chowder Rule: green means likely, yellow means less likely, and red means unlikely
- Price: green if Price ≤ Buy Below
My risk-adjusted Buy Below prices allow premium valuations for the highest-quality stocks but require discounted valuations for lower-quality stocks:
Undervalued Dividend Aristocrats
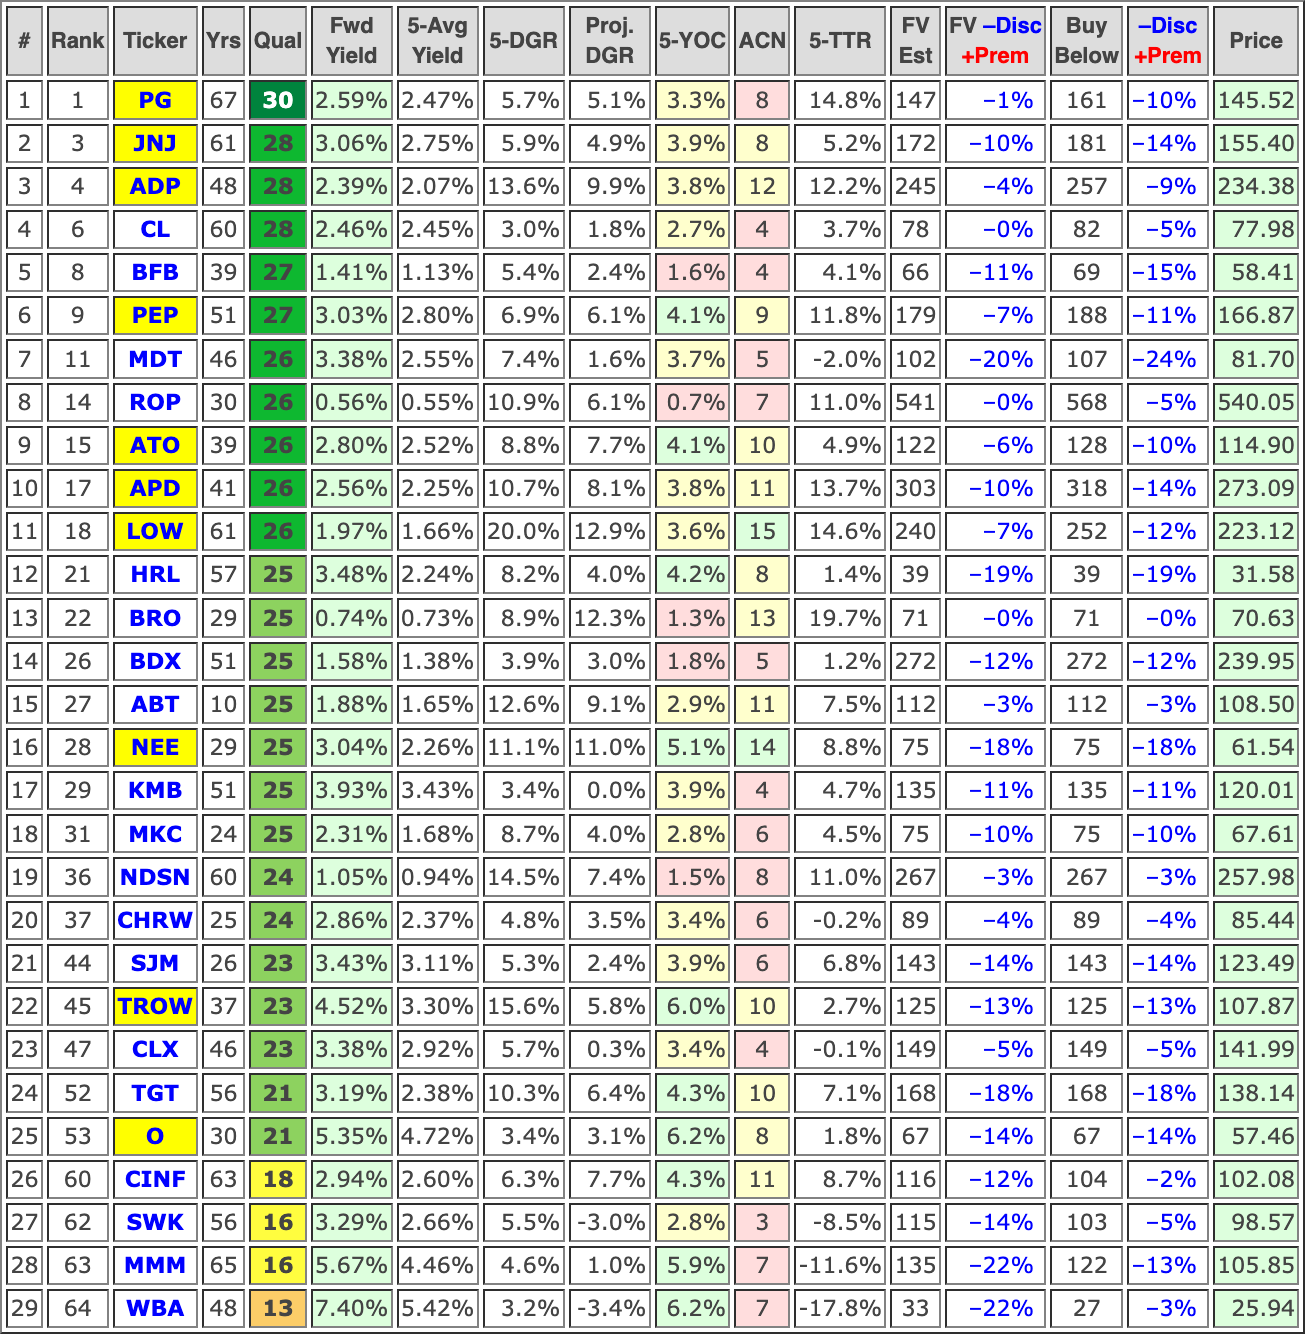
The first table contains the undervalued Dividend Aristocrats that pass my three valuation screens:
- Forward dividend yield > 5-year average dividend yield
- Stock price < Fair Value estimate
- Stock price < risk-adjusted Buy Below price
| # | Rank | Company (Ticker) | Sector | Supersector |
| 1 | 1 | Procter & Gamble (PG) | Consumer Staples | Defensive |
| 2 | 3 | Johnson & Johnson (JNJ) | Health Care | Defensive |
| 3 | 4 | Automatic Data Processing (ADP) | Industrials | Sensitive |
| 4 | 5 | Colgate-Palmolive (CL) | Consumer Staples | Defensive |
| 5 | 8 | Brown-Forman (BFB) | Consumer Staples | Defensive |
| 6 | 9 | PepsiCo (PEP) | Consumer Staples | Defensive |
| 7 | 11 | Medtronic plc (MDT) | Health Care | Defensive |
| 8 | 15 | Atmos Energy (ATO) | Utilities | Defensive |
| 9 | 17 | Air Products and Chemicals (APD) | Materials | Cyclical |
| 10 | 18 | Lowe's (LOW) | Consumer Discretionary | Cyclical |
| 11 | 21 | Hormel Foods (HRL) | Consumer Staples | Defensive |
| 12 | 22 | Brown & Brown (BRO) | Financials | Cyclical |
| 13 | 26 | Becton, Dickinson (BDX) | Health Care | Defensive |
| 14 | 27 | Abbott Laboratories (ABT) | Health Care | Defensive |
| 15 | 28 | NextEra Energy (NEE) | Utilities | Defensive |
| 16 | 29 | Kimberly-Clark (KMB) | Consumer Staples | Defensive |
| 17 | 31 | McCormick (MKC) | Consumer Staples | Defensive |
| 18 | 33 | McDonald's (MCD) | Consumer Discretionary | Cyclical |
| 19 | 36 | Nordson (NDSN) | Industrials | Sensitive |
| 20 | 37 | C.H. Robinson Worldwide (CHRW) | Industrials | Sensitive |
| 21 | 44 | J. M. Smucker (SJM) | Consumer Staples | Defensive |
| 22 | 45 | T. Rowe Price (TROW) | Financials | Cyclical |
| 23 | 47 | Clorox (CLX) | Consumer Staples | Defensive |
| 24 | 52 | Target (TGT) | Consumer Staples | Defensive |
| 25 | 53 | Realty Income (O) | Real Estate | Cyclical |
| 26 | 60 | Cincinnati Financial (CINF) | Financials | Cyclical |
| 27 | 62 | Stanley Black & Decker (SWK) | Industrials | Sensitive |
| 28 | 63 | 3M (MMM) | Industrials | Sensitive |
| 29 | 64 | Walgreens Boots Alliance (WBA) | Consumer Staples | Defensive |
I own 12 of the undervalued Dividend Aristocrats. Of these, PG, JNJ, PEP, APD, and HRL are underweight positions. Based on how I calculate target weights, I'd need to add 46 shares of PG, 47 shares of JNJ, 12 shares of PEP, 60 shares of APD, and 286 shares of HRL to turn these into full-sized positions.
None of the stocks I don't own pass my stock selection criteria for adding new positions:
- Stock Quality: Quality scores ≥ 21 (Exceptional, Excellent, or Fine ratings)
- Stock Valuation: Price ≤ Buy Below (trades below my risk-adjusted Buy Below price
- Growth Outlook: Qualifying ACNs (likely to deliver annualized returns of 8%)
- Income Outlook: 5-year YoC ≥ 4.00% (likely to have high YOCs after five years of ownership)
- Dividend Quality: A+ or A Dividend Quality Grades
Consequently, I'm not looking to add any of this month's undervalued Dividend Aristocrats to my portfolio.
Overvalued Dividend Aristocrats
The following table contains overvalued Dividend Aristocrats that fail one or more of my valuation screens.
| # | Rank | Company (Ticker) | Sector | Supersector |
| 1 | 2 | Walmart (WMT) | Consumer Staples | Defensive |
| 2 | 5 | General Dynamics (GD) | Industrials | Sensitive |
| 3 | 7 | Linde plc (LIN) | Materials | Cyclical |
| 4 | 10 | W.W. Grainger (GWW) | Industrials | Sensitive |
| 5 | 12 | Chubb (CB) | Financials | Cyclical |
| 6 | 13 | A. O. Smith (AOS) | Industrials | Sensitive |
| 7 | 14 | Roper Technologies (ROP) | Information Technology | Sensitive |
| 8 | 16 | Cintas (CTAS) | Industrials | Sensitive |
| 9 | 19 | Sherwin-Williams (SHW) | Materials | Cyclical |
| 10 | 20 | Coca-Cola (KO) | Consumer Staples | Defensive |
| 11 | 23 | West Pharmaceutical Services (WST) | Health Care | Defensive |
| 12 | 24 | Ecolab (ECL) | Materials | Cyclical |
| 13 | 25 | Caterpillar (CAT) | Industrials | Sensitive |
| 14 | 30 | Illinois Tool Works (ITW) | Industrials | Sensitive |
| 15 | 32 | Emerson Electric (EMR) | Industrials | Sensitive |
| 16 | 34 | Aflac (AFL) | Financials | Cyclical |
| 17 | 35 | Church & Dwight (CHD) | Consumer Staples | Defensive |
| 18 | 38 | Chevron (CVX) | Energy | Sensitive |
| 19 | 39 | Dover (DOV) | Industrials | Sensitive |
| 20 | 40 | S&P Global (SPGI) | Financials | Cyclical |
| 21 | 41 | PPG Industries (PPG) | Materials | Cyclical |
| 22 | 42 | Consolidated Edison (ED) | Utilities | Defensive |
| 23 | 43 | Exxon Mobil (XOM) | Energy | Sensitive |
| 24 | 46 | Cardinal Health (CAH) | Health Care | Defensive |
| 25 | 48 | Archer-Daniels-Midland (ADM) | Consumer Staples | Defensive |
| 26 | 49 | Genuine Parts (GPC) | Consumer Discretionary | Cyclical |
| 27 | 50 | Albemarle (ALB) | Materials | Cyclical |
| 28 | 51 | Expeditors International of Washington (EXPD) | Industrials | Sensitive |
| 29 | 54 | AbbVie (ABBV) | Health Care | Defensive |
| 30 | 55 | Sysco (SYY) | Consumer Staples | Defensive |
| 31 | 56 | Franklin Resources (BEN) | Financials | Cyclical |
| 32 | 57 | International Business Machines (IBM) | Information Technology | Sensitive |
| 33 | 58 | Essex Property (ESS) | Real Estate | Cyclical |
| 34 | 59 | Nucor (NUE) | Materials | Cyclical |
| 35 | 61 | Federal Realty Investment (FRT) | Real Estate | Cyclical |
I own 9 of the overvalued Dividend Aristocrats. KO is the only underweight position, and I would have to add 76 shares to turn it into a full-sized position.
The Dividend Aristocrats I don't own are of little interest to me as they're overvalued and do not pass my stock selection criteria for adding new positions.
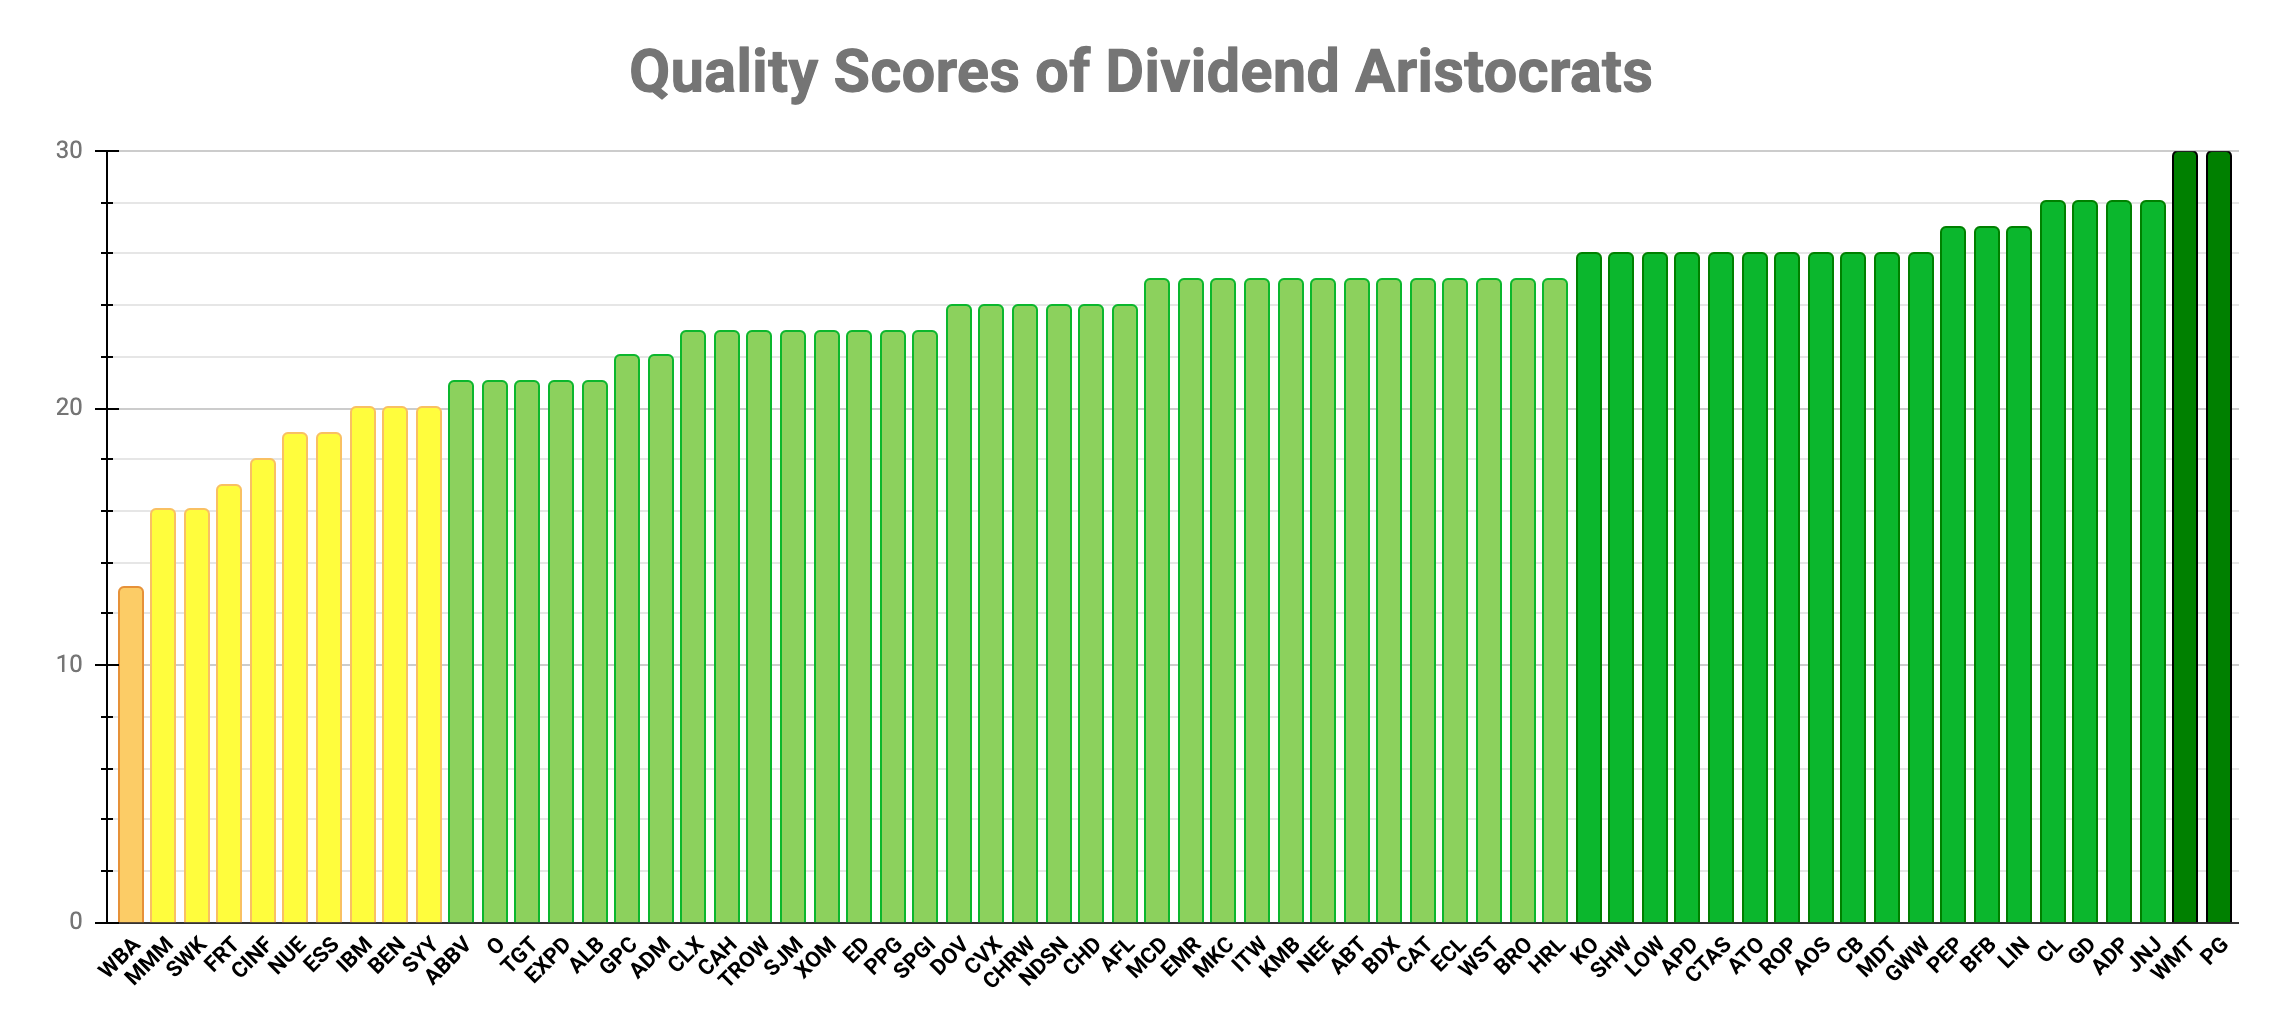
The following is a visual representation of the Dividend Aristocrats' quality scores in rank order from lowest to highest:
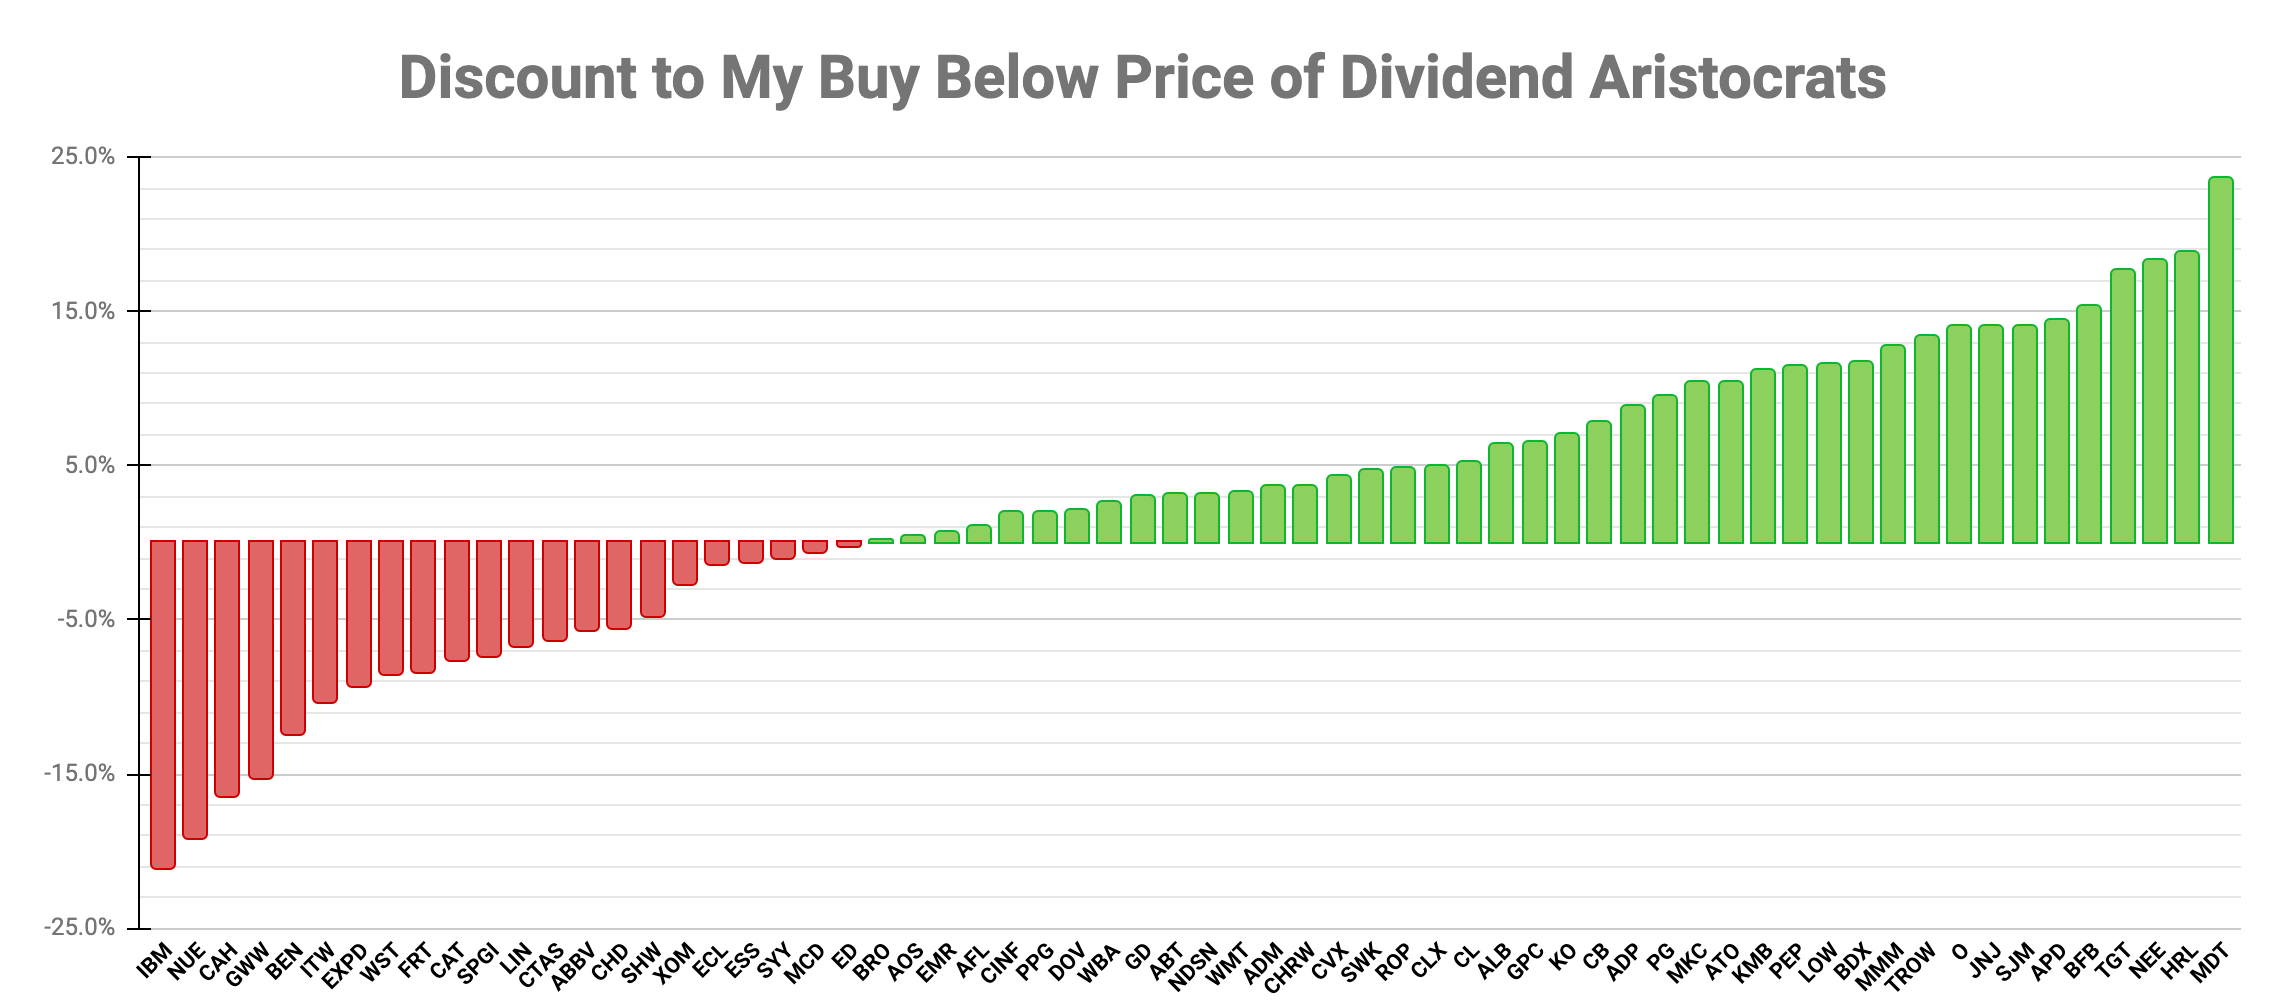
And here is a ranking chart showing the discount to my Buy Below price of the Dividend Aristocrats:
Uncovered Dividend Aristocrats
Three Dividend Aristocrats are not covered in this article, as they don't have long histories of paying and raising dividends.
Amcor plc (AMCR) is a holding company engaged in the consumer packaging business. Its dividend increase streak is only four years:
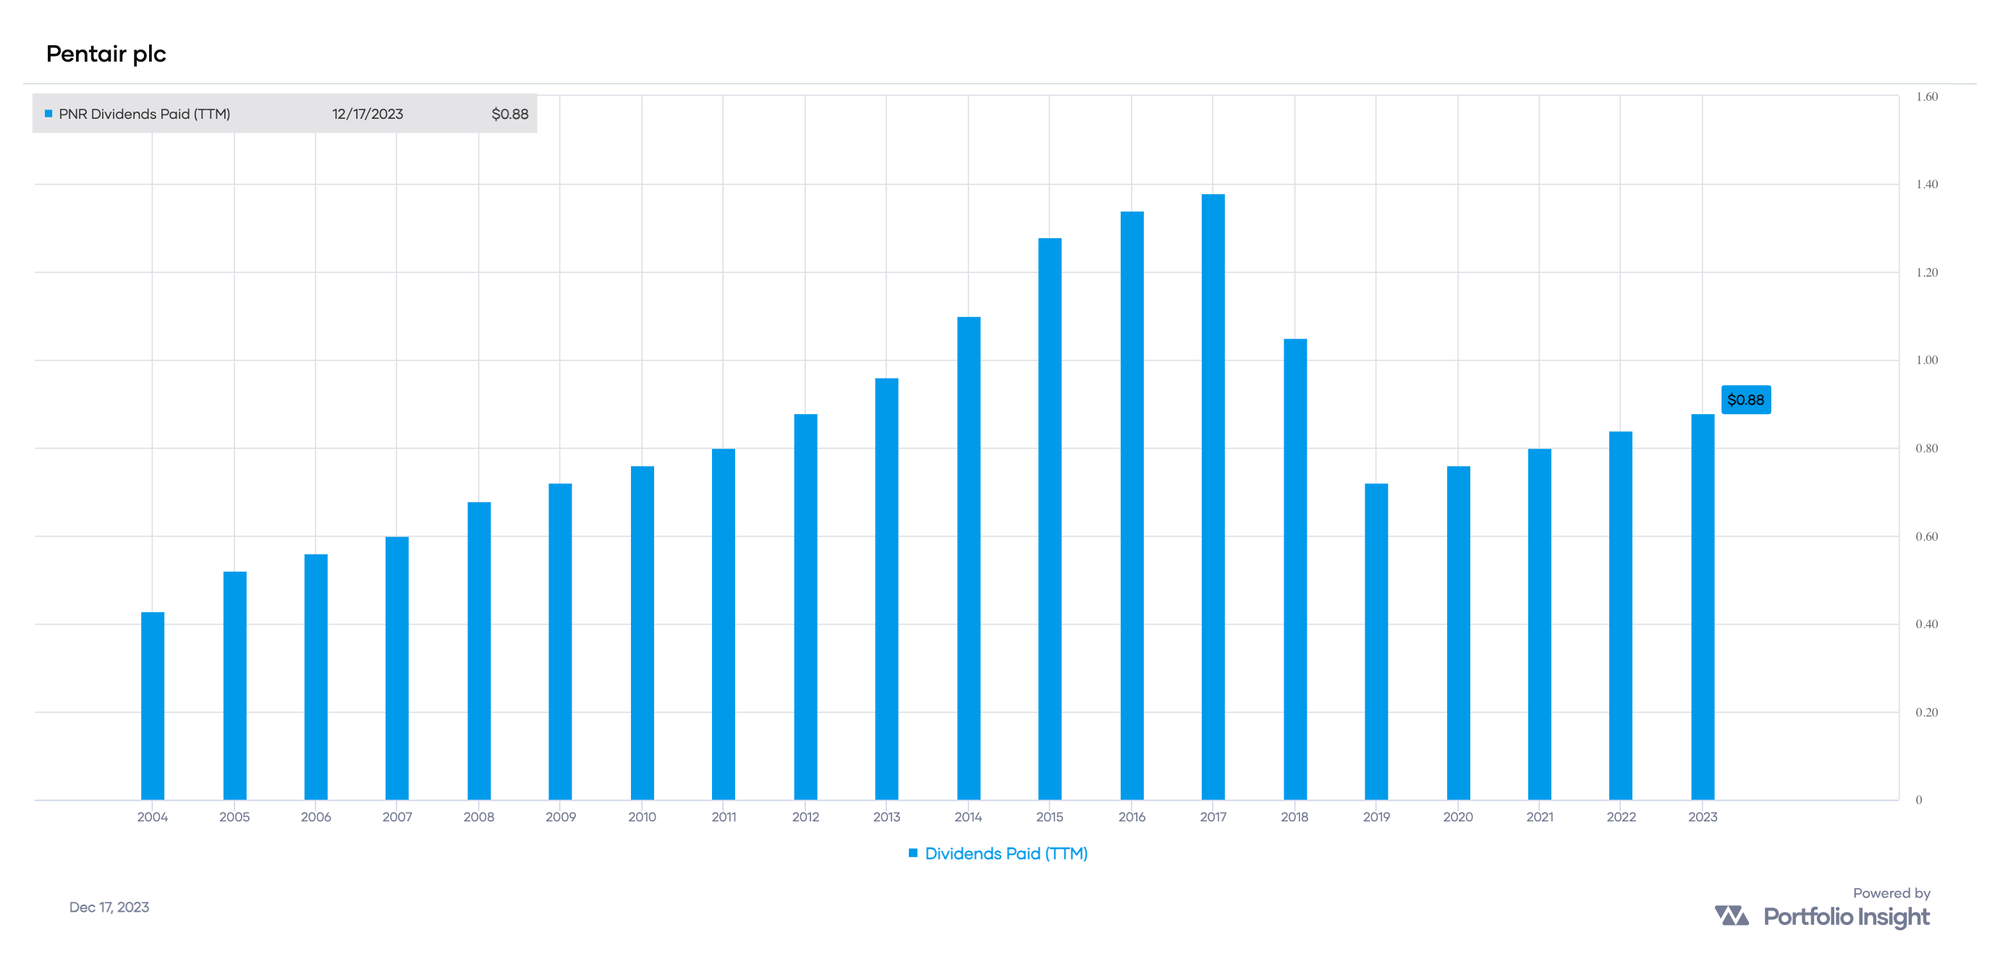
Pentair plc (PNR) provides water solutions for residential, commercial, industrial, infrastructure, and agriculture applications. The company cut its dividend in 2018 and has since rebuilt a streak of four years of dividend increases:
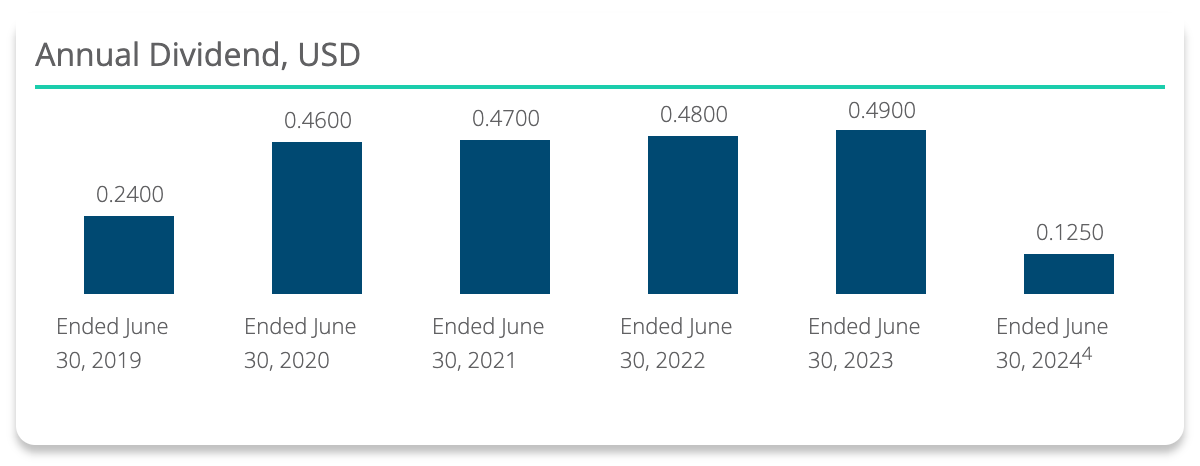
Kenvue Inc (KVUE) was spun off by Johnson & Johnson and started trading on May 4, 2024. So far, the new company has paid two quarterly dividends of 20¢ per share in 2023.
Whether KVUE will remain in the S&P 500 Dividend Aristocrats Index depends on whether it indicates "it will continue and/or initiate a consistent dividend-paying policy." If so, S&P Global assigns the dividend increase history of the parent company to the spun-off company and combines their dividends for two full calendar years before each company is tracked independently.
Portfolio Insight handles spin-offs differently when determining dividend increase streaks. As a new business entity with a separate board, each spin-off must build its own dividend streak. This is a data-driven rather than a "grandfathering" approach. It should also be noted that no spin-off company displays its parent's financial and dividend history on its website.
Dividend Aristocrats: Top Opportunities
Let's now use some screens to isolate undervalued Dividend Aristocrats with compelling metrics.
Projected Dividend Growth Rate
Companies pay dividends from earnings, and earnings depend on revenue. The projected dividend growth rate [Proj-DGR] is a conservative estimate of future dividend growth based on the historical 5-year growth rates of dividends, earnings, and revenue.
I like seeing a Proj-DGR of at least 10%.
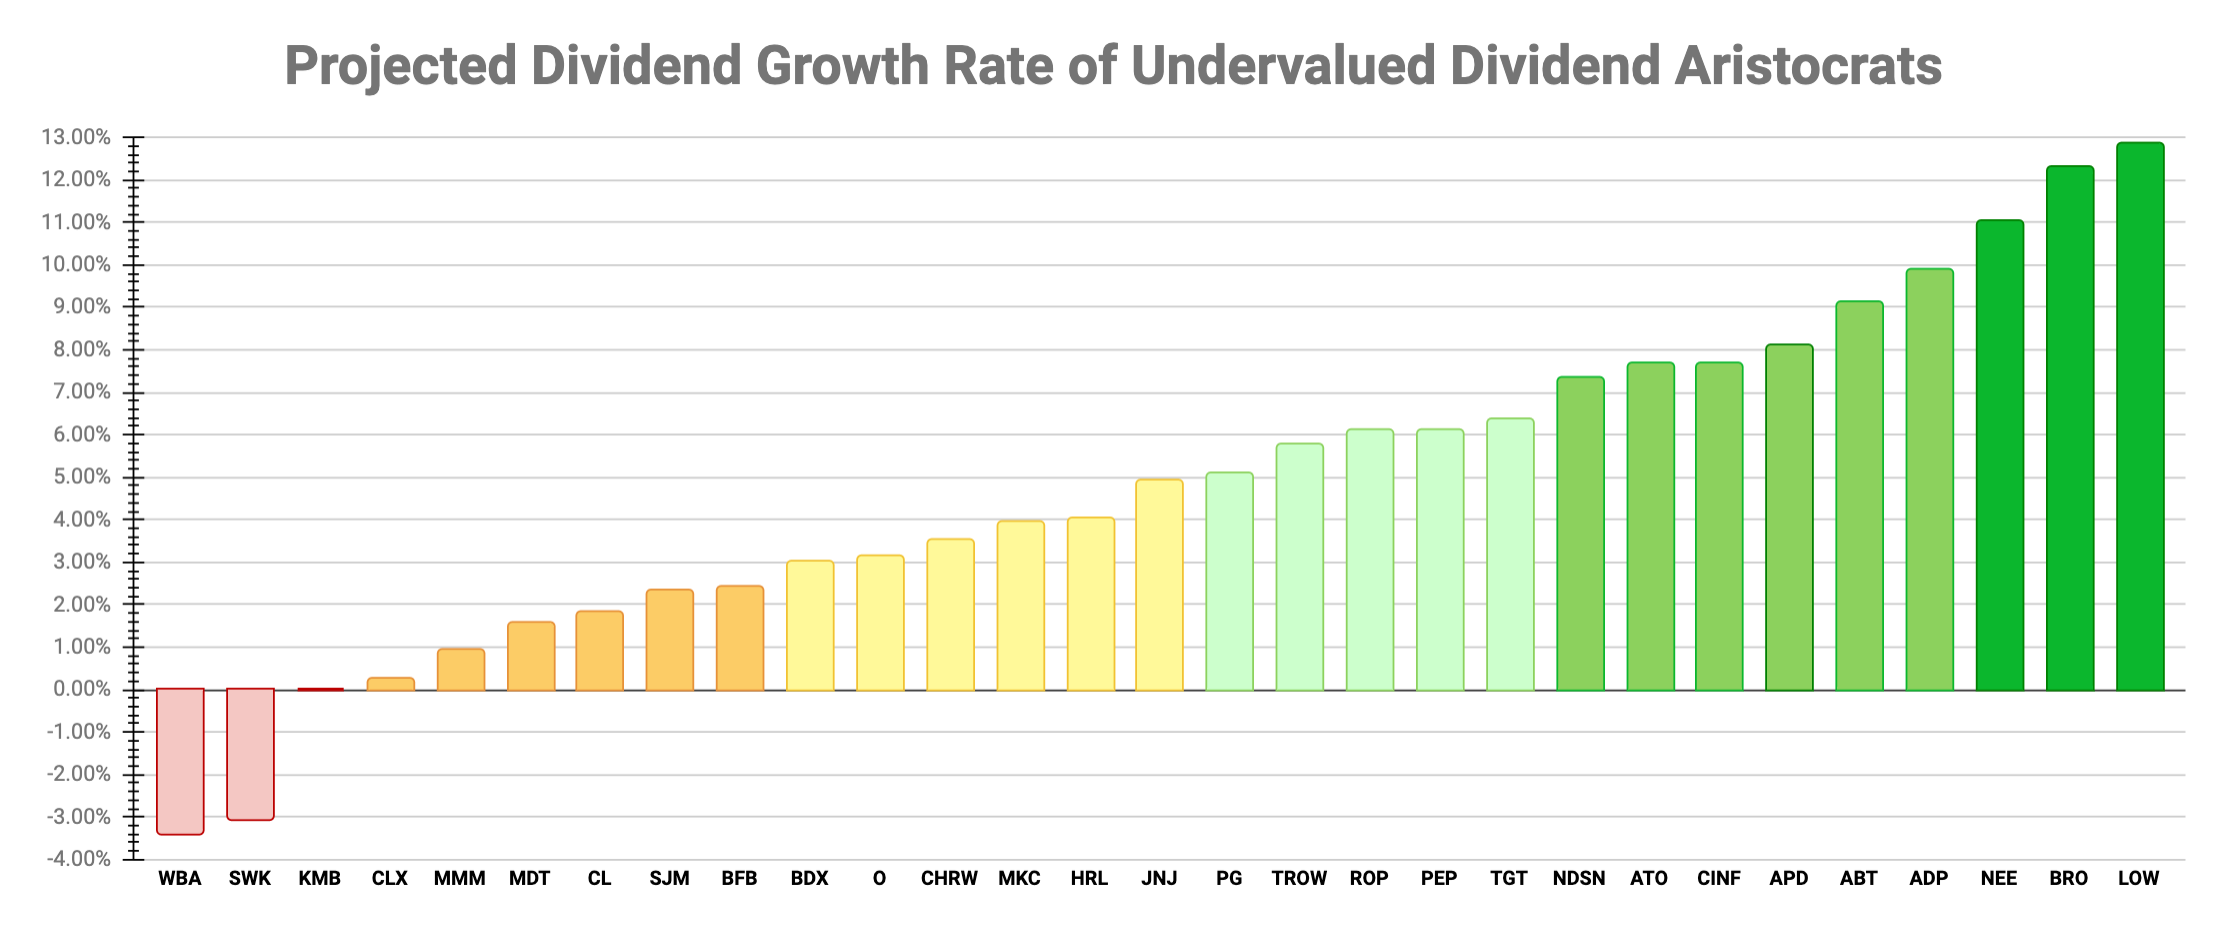
Lowe's (LOW), Brown & Brown (BRO), and NextEra Energy (NEE) have double-digit percentage projected dividend growth rates. These stocks are excellent choices for growth-oriented investors.
Adjusted Chowder Number
I consider the Adjusted Chowder Number [ACN] to determine a stock's total return prospects. In calculating the ACN, I use the projected dividend growth rate instead of the 5-year dividend growth rate.
I prefer favorable ACNs (those color-coded green) likely to deliver annualized total returns of at least 8%.
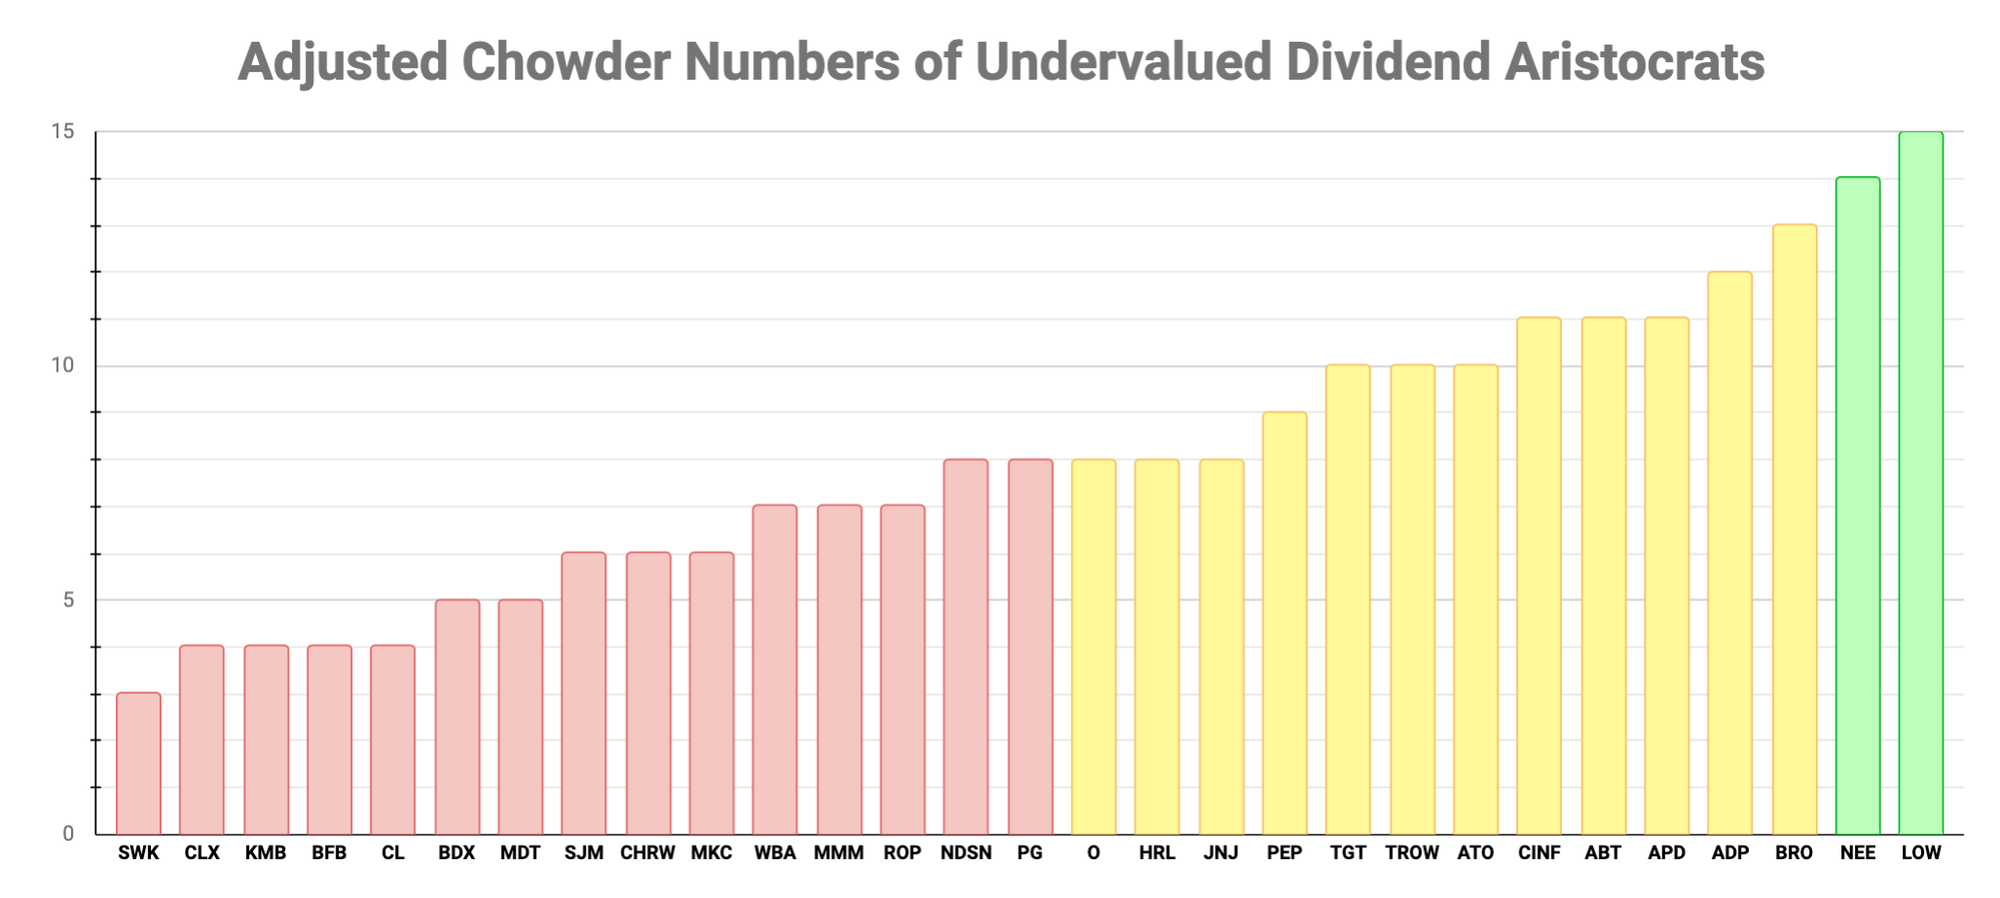
Lowe's and NextEra Energy have ACNs of 15 and 14, respectively. Due to their high projected DGRs, I expect LOW and NEE to deliver annualized total returns of at least 8%. These stocks will suit investors who are focused on total returns (stock appreciation and dividend income).
Projected 5-Year Yield on Cost
The projected 5-year yield on cost [5-YOC] is an income-oriented metric indicating the expected yield on cost after buying and holding a stock for five years.
I look for a projected 5-YOC of at least 4.0%.
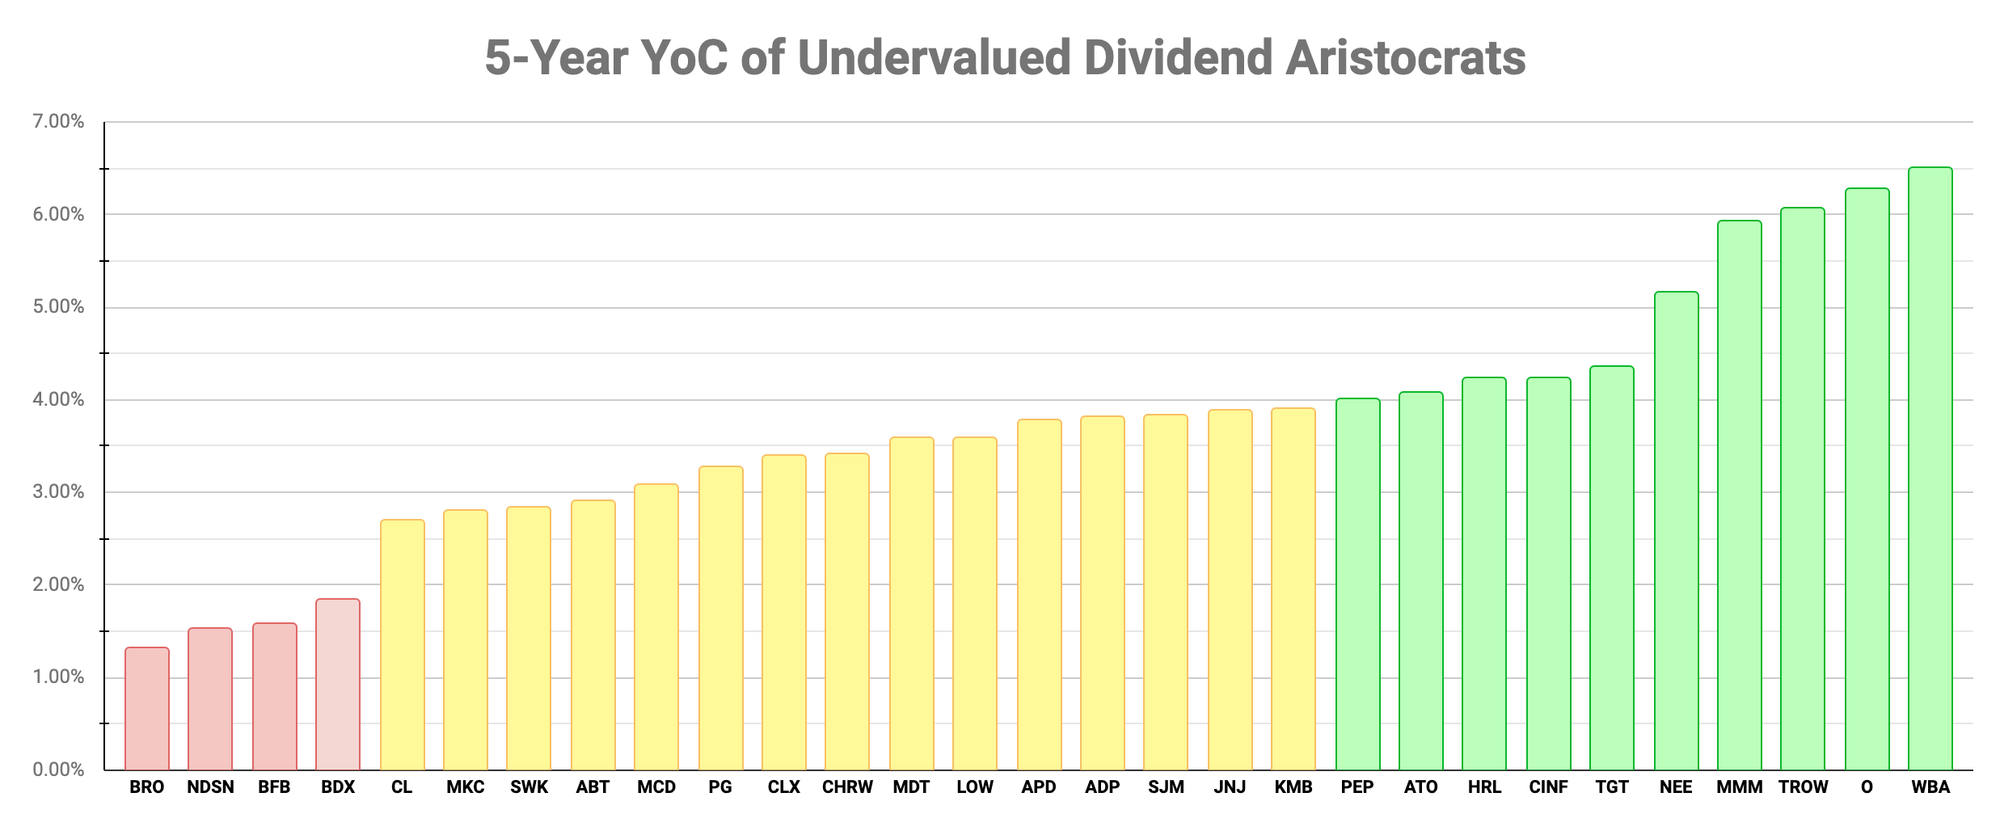
Walgreens Boots Alliance (WBA) tops the list with a 5-YOC of 6.4%. I would avoid WBA due to its low quality score. Realty Income (O), T. Rowe Price (TROW), 3M (MMM), and NextEra Energy (NEE) all have 5-YOCs above 5%, though I would also avoid MMM due to its lower quality score.
5-year Trailing Total Returns
The 5-year trailing total returns [5-TTR] metric includes returns due to stock price appreciation (or depreciation) and dividend payments over the trailing 5-year period.
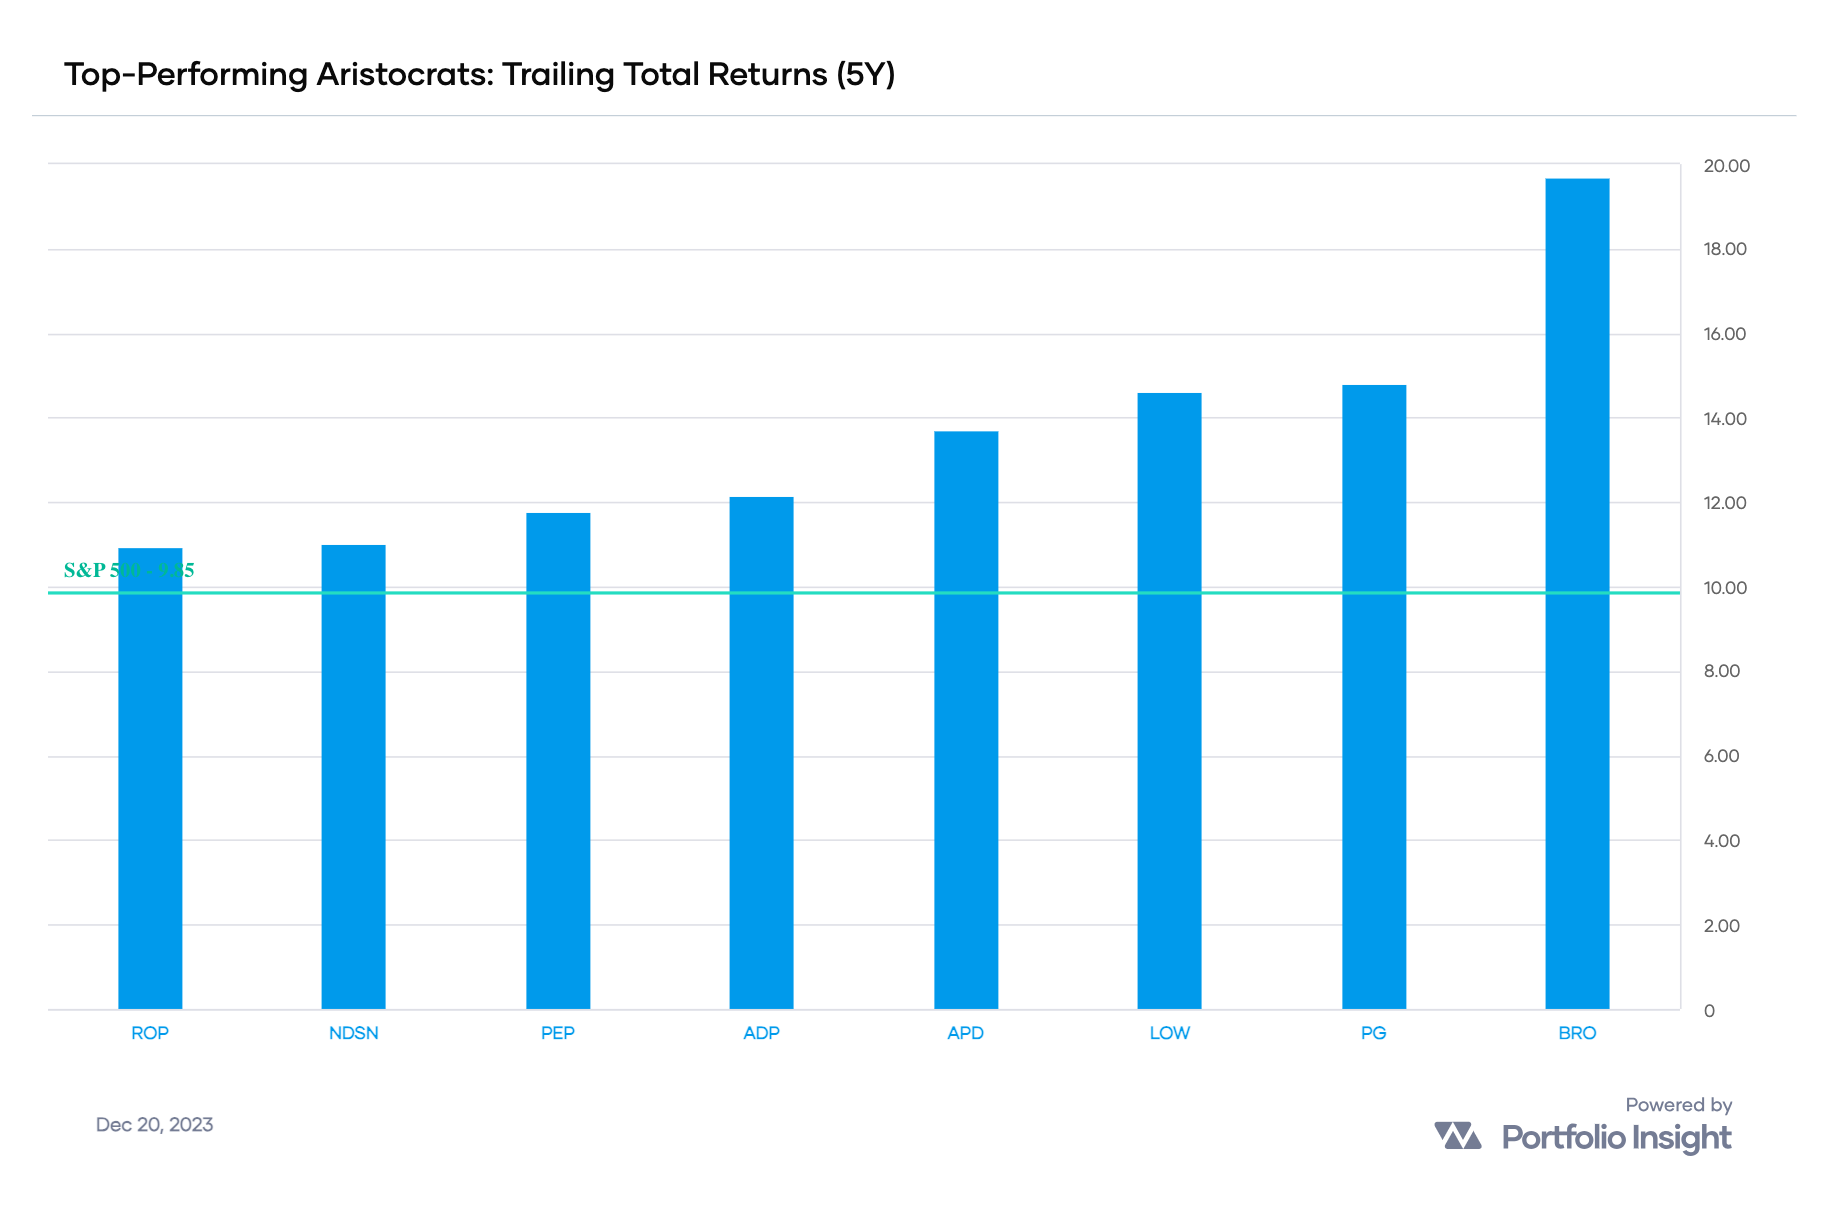
I like to see a 5-TTR of at least 10%.
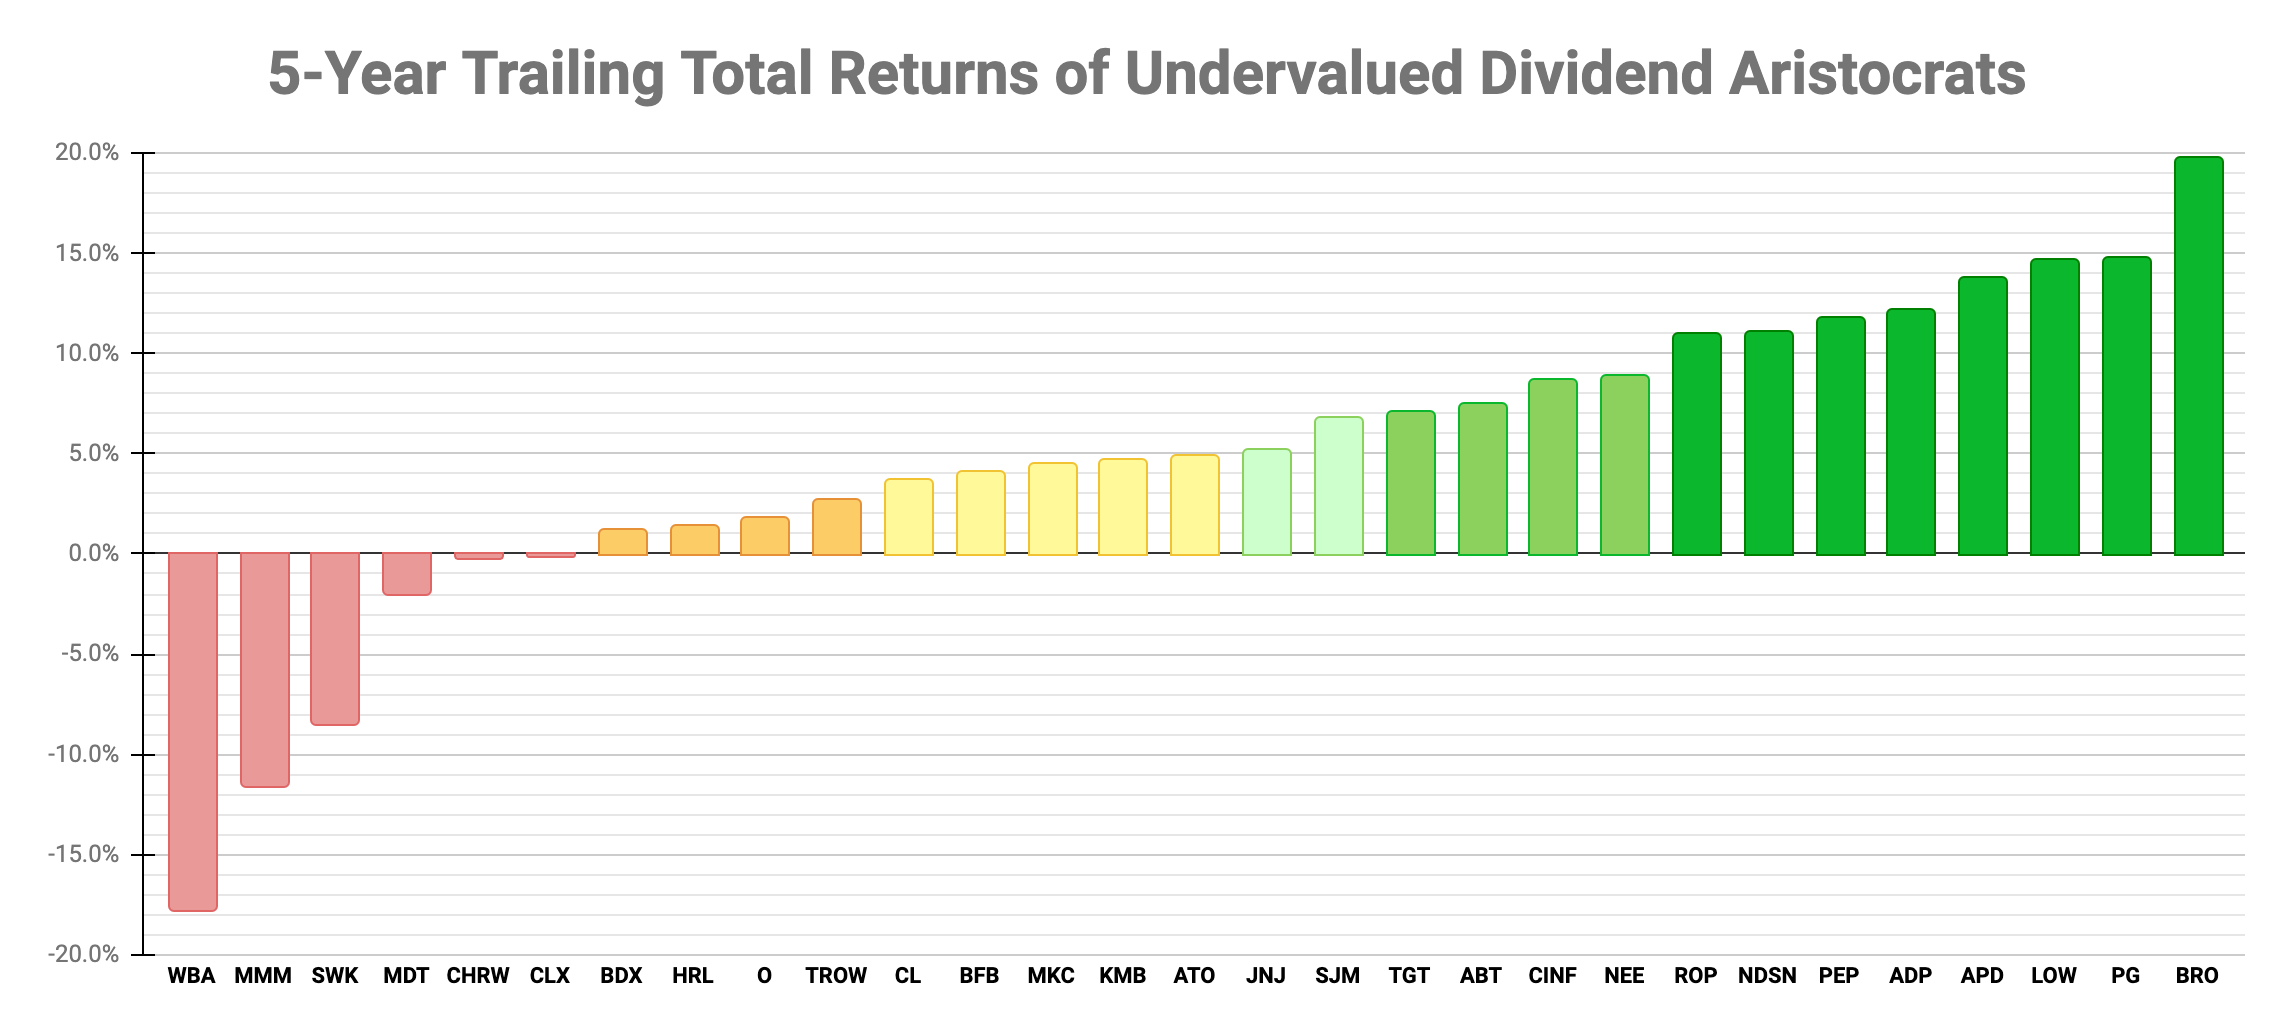
Brown & Brown (BRO) is the top-performing Dividend Aristocrat over the trailing 5-year period with a 5-TTR of 19.7%. Eight undervalued Dividend Aristocrats outperformed the S&P 500 (represented by the SPDR S&P 500 ETF Trust [SPY]).
Concluding Remarks
In this article, I ranked 64 of the 67 Dividend Aristocrats by quality score and presented undervalued stocks for further research and possible investment. I excluded 3 Dividend Aristocrats with a limited history of paying and raising dividends.
My quality scoring system employs six quality indicators, each worth 5 points, for a maximum quality score of 30 points. I used three valuation screens to find 29 undervalued Dividend Aristocrats.
Of the 64 Dividend Aristocrats covered in this article:
- All but one (WBA) have Investment Grade ratings based on their quality scores of 16-30,
- 42 stocks are trading below my risk-adjusted Buy Below prices, and
- 54 stocks have quality scores in the 21-30 range; they are truly high-quality!
I've highlighted a few discounted stocks offering compelling metrics. By compelling metrics, I mean stocks with superior growth and income outlooks.
Here are some candidates to consider depending on your investment style:
- For growth: LOW, BRO, and NEE
- For total return: LOW and NEE
- For income: O, TROW, and NEE
- Based on past performance: BRO
This article provided you with some good candidates to consider! As always, I encourage you to do your due diligence before investing.
I'm providing a downloadable spreadsheet of the Dividend Aristocrats. The spreadsheet includes the data presented in this article and data supplied by Portfolio Insight in their Dividend Radar spreadsheet. I hope readers find this snapshot of fundamental and added value metrics helpful in analyzing the Dividend Aristocrats.
Note that I cannot grant permission for you to edit the spreadsheet, as it is a read-only file that every Seeking Alpha reader can access!
But you can create a copy of the spreadsheet to edit. Click on this link to the Dividend Aristocrats spreadsheet. To copy the spreadsheet, sign in with a Google account and select File | Make a Copy to save a copy of the spreadsheet on your computer.
Thanks for reading, and happy investing!