How to Assess Dividend Quality
Many dividend growth investors like to invest in high-quality stocks. This article explains how I assess the quality of dividend growth stocks using an elegant system first proposed by David Van Knapp.

I'm keeping this article around as a landing spot for search engines, but I encourage you to read Updating my Dividend Quality Scoring System for the latest and greatest on assessing dividend quality!
History
In February 2019, David Van Knapp presented an elegant quality scoring system for dividend growth stocks. When I learned about the system David called Quality Snapshots, I immediately adopted it for managing my portfolio and for articles I write on dividend growth investing.
David and I started corresponding on ways to improve Quality Snapshots, and we agreed on making several changes over the years. He welcomed my use of a nearly identical version of Quality Snapshots and appreciated my consistently crediting him as the originator. Nevertheless, he encouraged experimentation and perhaps anticipated that we'd want to go in different directions with Quality Snapshots.
In 2022, I made some changes to David's original system, culminating in the system I now use to assess the quality of dividend growth stocks.
Methodology
There are many ways to define dividend quality, but David proposed using independent quality indicators from trusted information sources. His Quality Snapshots system employs five well-known quality indicators and assigns 0-5 points to each quality indicator, for a maximum of 25 points.
I replaced one of the original quality indicators in my modified system and added another. I also made some changes to how quality indicators are scored. Here are the six quality indicators I now use:
- Value Line [VL] Price Stability score
- Value Line [VL] Financial Strength rating
- Morningstar [MS] Economic Moat
- S&P Global [SP] Credit Ratings
- Simply Safe Dividends [SS] Dividend Safety Scores
- Portfolio Insight [PI] Dividend Quality Grade
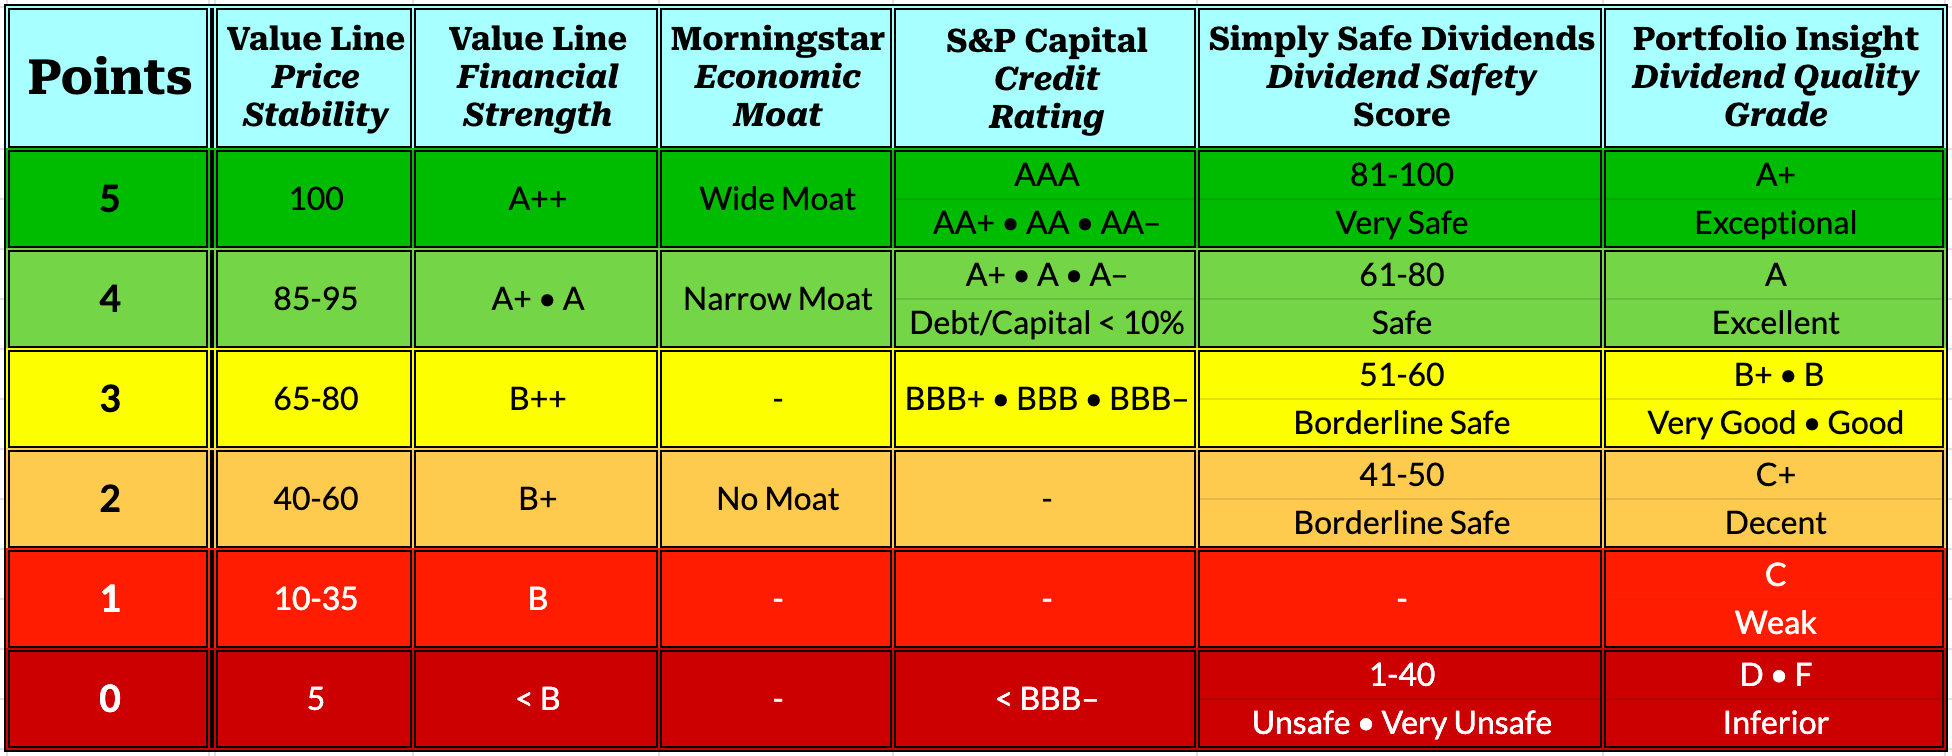
The Price Stability score is based on a ranking of the standard deviation of weekly percent changes in the price of a stock over the last five years. VL presents the score on a scale of 100 (highest) to 5 (lowest) in increments of 5. A stock that fluctuates widely around its long-term trend line is riskier. As a long-term investor, I prefer stocks with stable price action and consistent growth.
The Financial Strength rating measures a company's financial condition. It is reported on a scale of A++ to C. VL considers fundamentals such as net income, cash flow, debt to equity, profit outlook, industry stability, and company return to assign ratings. Ratings of B or B+ are considered average. The lowest rating of C is reserved for companies in severe financial difficulty.
The Economic Moat is a proprietary data point from MS that reflects a company's sustainable competitive advantage. A company with a wide economic moat can fend off competition and earn high returns on capital for at least 20 years, whereas a narrow-moat company can do so for at least ten years. A no-moat company has either no advantage or one that will quickly dissipate.
The Credit Ratings from SP are forward-looking opinions about the ability and willingness of debt issuers to meet their financial obligations on time and in full. Credit ratings address creditworthiness rather than investment merit. The rating scale ranges from AAA to D, with BBB- and higher considered investment grade ratings, and BB+ and lower regarded as speculative grade.
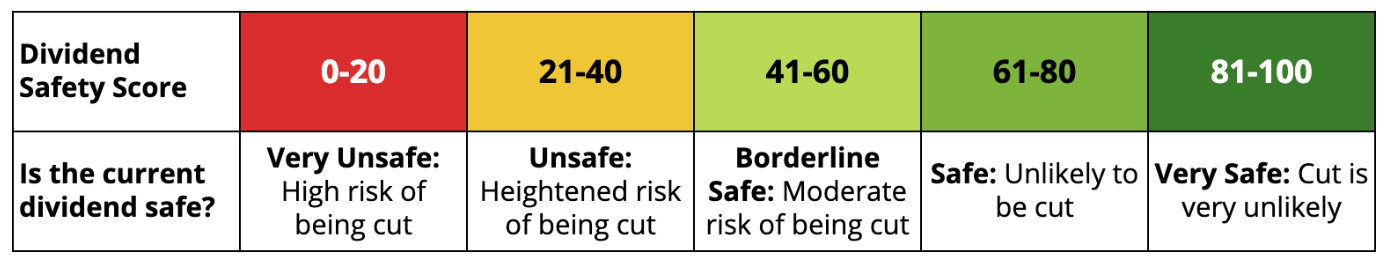
The Dividend Safety Scores predict dividend risk over a complete economic cycle. SS determines scores based on an analysis of dividend-related metrics, including payout ratios, debt levels, recession performance, dividend longevity, industry cyclicality, free cash flow, and analyst estimates. Scores range from 0 to 100:
With the Dividend Quality Grade, PI differentiates between companies likely to increase their dividend during the next 12 months and companies at risk of freezing or cutting their dividends. Grades range from A+ to F, with F indicating companies at significant risk of cutting their dividends. PI considers earnings, revenue, dividend performance, and performance and financial strength metrics to assign the grades.
Quality Scores
As for Quality Snapshots, I assign 0-5 points to each quality indicator. With six quality indicators scoring up to 5 points each, the maximum quality score is 30 points.
I considered the distribution of scores of more than 700 dividend growth stocks in Dividend Radar to assign scores to each quality indicator.
Generally, only the very best ratings and highest scores earn 5 points. Some quality indicators do not map to every point in the scoring system. For example, MS distinguishes between wide, narrow, and no moats. The scoring system assigns 5 points for wide moats, 4 for narrow moats, and 2 for no moats.
SP considers stocks with credit ratings of AAA through BBB– as investment-grade stocks. A stock gets either 5, 4, 3, or 0 points depending on its credit rating. If a stock doesn't have a credit rating, it gets no points unless its Dept/Capital < 10%, in which case it earns 4 points.
The five categories of Dividend Safety Scores are split into three safe and two unsafe categories. Following a recent update by David Van Knapp, I'm assigning no points to unsafe scores and splitting the Borderline Safe category into two halves that score 3 and 2 points, respectively.
How my approach differs from Quality Snapshots
- Six quality indicators instead of five
– I added PI's Dividend Quality Grade, which provides a data-driven approach to determining the likelihood of dividend increases in the next 12 months and the risk of dividend freezes, cuts, or suspensions. - Price Stability instead of Safety Rank
– VL's Safety Rank combines Price Stability and Financial Strength, which is already used as a quality indicator. By implication, Quality Snapshots give Financial Strength more prominence than the other quality indicators. - Financial Strength ratings are scored differently
– After comparing the distribution of scores for Financial Strength to those of the other quality indicators, I moved A and B++ each up one slot. So, A now scores 4, and B++ scores 3. - Compensation for stocks not covered by VL
– VL contributes two quality indicators and up to 10 points to a stock's quality score. If a stock is not covered by VL, the impact is excessive. I multiply the stock's quality score by 28/20 (and ignore the decimal digits) to compensate for the lack of VL coverage.
Quality Ratings
As mentioned earlier, the maximum quality score is 30 points. I distinguish between the following ratings depending on a stock's total quality score:
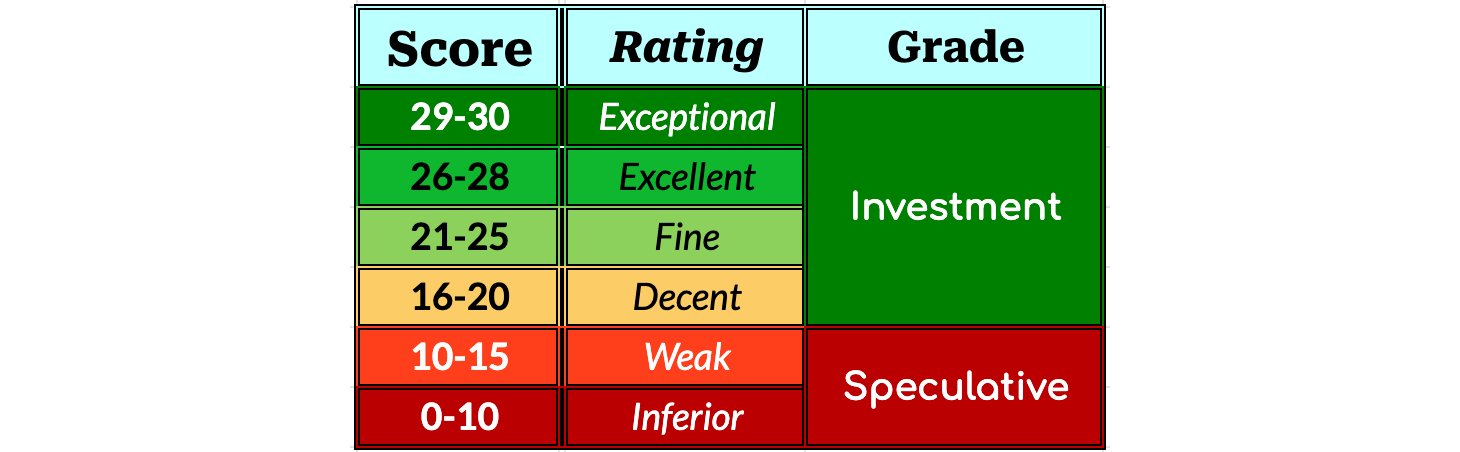
Generally, I invest in stocks rated Exceptional, Excellent, and Fine. In some circumstances, such as with high-yielding defensive stocks, I'll also consider stocks rated Decent.
I consider stocks with quality scores in the range of 16-30 to be Investment Grade stocks, while stocks with quality scores below 16 are Speculative Grade stocks.
Ranking Stocks
I frequently write articles about dividend growth stocks with similar characteristics, such as the Dividend Kings (stocks with dividend increase streaks of 50+ years) and the Dividend Aristocrats (S&P 500 stocks with dividend increase streaks of 25+ years). In such articles, I like ranking the stocks for presentation purposes.
To rank dividend growth stocks, I sort them in descending order by the quality score and break ties by considering the following factors in turn:
- SS Dividend Safety Scores
- SP Credit Ratings
- Forward Dividend Yield
For example, six stocks were rated Exceptional when I wrote this article.
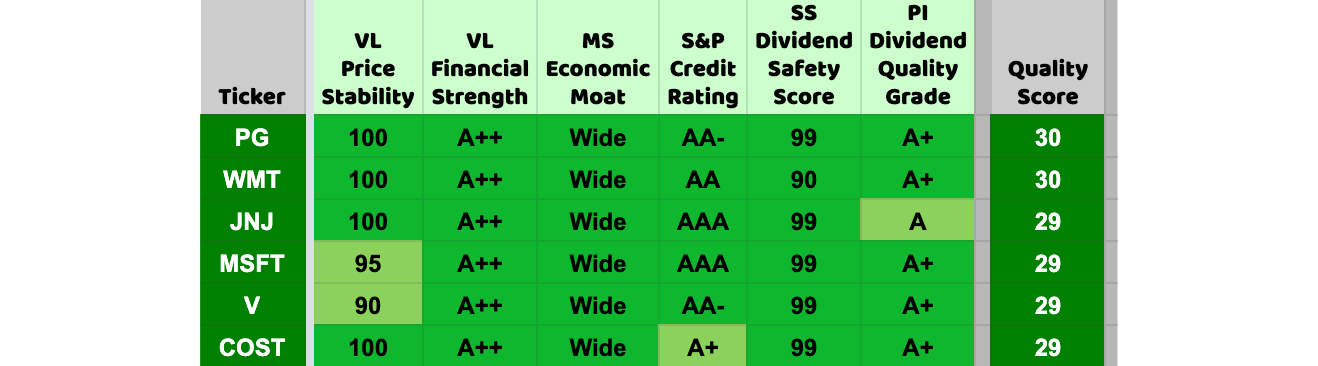
- Only Procter & Gamble (PG) and Walmart (WMT have perfect quality scores of 30. I consider their Dividend Safety Scores first to break the tie between PG and WMT. Both have Very Safe scores, but PG's is 99 and WMT's is 90. So, PG ranks first.
- There are four stocks with quality scores of 29, Johnson & Johnson (JNJ), Microsoft (MSFT), Visa (V), and Costco Wholesale (COST). All four have Dividend Safety Scores of 99. So, I consider the next tie-breaker, their Credit Ratings. JNJ and MSFT have AAA credit ratings, placing them above V and COST. JNJ tops MSFT based on its forward dividend yield of 2.90%, which exceeds MSFT's 1.09%. V is ranked higher than COST based on its AA- credit rating.
Conclusion
For DivGro 2.0, I use a variation of Quality Snapshots to assess the quality of dividend growth stocks. It uses VL's Price Stability instead of VL's Safety Rank and adds a new quality indicator, PI's Dividend Quality Grade. Moreover, I made some scoring changes, mainly to have similar distributions of scores across the quality indicators and to compensate for stocks lacking VL coverage.