The Chowder Rule
The Chowder Rule is a popular heuristic for finding dividend growth stocks likely to deliver high annualized returns. By adding a stock's dividend yield and the 5-year dividend growth rate, investors can get an idea of the stock's total return potential.

The Chowder Rule is a popular heuristic for finding dividend growth stocks with the potential for delivering high total returns. Proposed and popularized by Seeking Alpha author Chowder, the Chowder Rule favors dividend growth stocks likely to produce annualized total returns of at least 8%.
To implement the Chowder Rule, add a stock's dividend yield and 5-year dividend growth rate [DGR] to obtain the so-called Chowder Number [C#]. Chowder required a margin of safety depending on the stock's yield and whether the stock is a utility stock. Stocks with lower yields have a higher margin of safety, while utility stocks yielding at least 4% have no margin of safety.
Here are the criteria Chowder used:
- Stocks yielding less than 3% require a C# of at least 15%.
- Stocks yielding at least 3% require a C# of at least 12%.
- Utility stocks yielding at least 4% require a C# of at least 8%.
Higher-yielding utility stocks get treated specially. Because utilities are regulated and enjoy regional competitive advantages, utility stocks have relatively stable yields and growth rates. As a result, Chowder elected to have no margin of safety requirements for utility stocks, provided they yield at least 4%.
Chowder recommended using the Chowder Rule only after finding high-quality stocks worthy of long-term investment. If used as recommended, the Chowder Rule will serve investors well by identifying stocks with good total return prospects among high-quality candidates.
For more about the Chowder Rule, see this article and Chowder's comments on the article.
How I use the Chowder Rule
I like providing key metrics and valuations of the stocks I cover in tabular form. Below is an example that includes the Chowder Number [C#]:
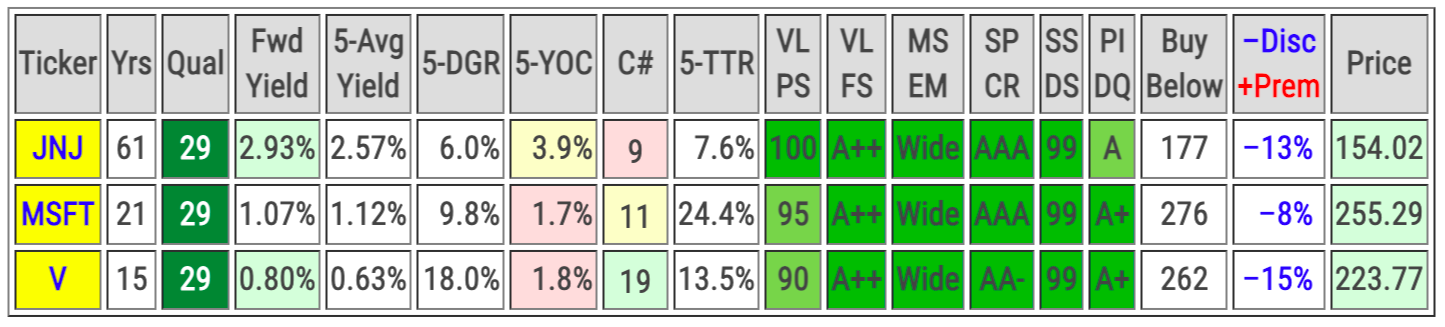
The C# column is color-coded based on the likelihood that a stock will deliver annualized returns of 8% or more:
- green indicates stocks likely to deliver annualized returns of 8%
- yellow indicates stocks less likely to deliver annualized returns of 8%
- red indicates stocks unlikely to deliver annualized returns of 8%
Color-coding the C# column is a visual aid, though I want to stress that only stocks with green cells in the C# column abide by the Chowder Rule and have favorable Chowder Numbers.
Here are the thresholds I use for color coding:
- Stocks yielding less than 3%: red < 10 ≤ yellow < 15 ≤ green
- Stocks yielding at least 3%: red < 8 ≤ yellow < 12≤ green
- Utility stocks yielding at least 4%: red < 5 ≤ yellow < 10 ≤ green
When considering new positions for my DivGro portfolio, I prefer candidates with favorable Chowder Numbers.
Issues with the Chowder Rule
While the Chowder Rule is sensible and intuitive, it uses a trailing metric (the 5-year DGR) to predict future growth. There is no guarantee that a company will maintain the same dividend growth rate in the future.
A high 5-year DGR could be pretty meaningless for predictions, actually.
The first few dividend increases of a company that initiated a dividend could be substantial, but the initial dividend growth rate is rarely sustainable. For example, Cisco Systems (CSCO) initiated a dividend in 2011, and it is clear that CSCO's 5-year DGR is decelerating rapidly:
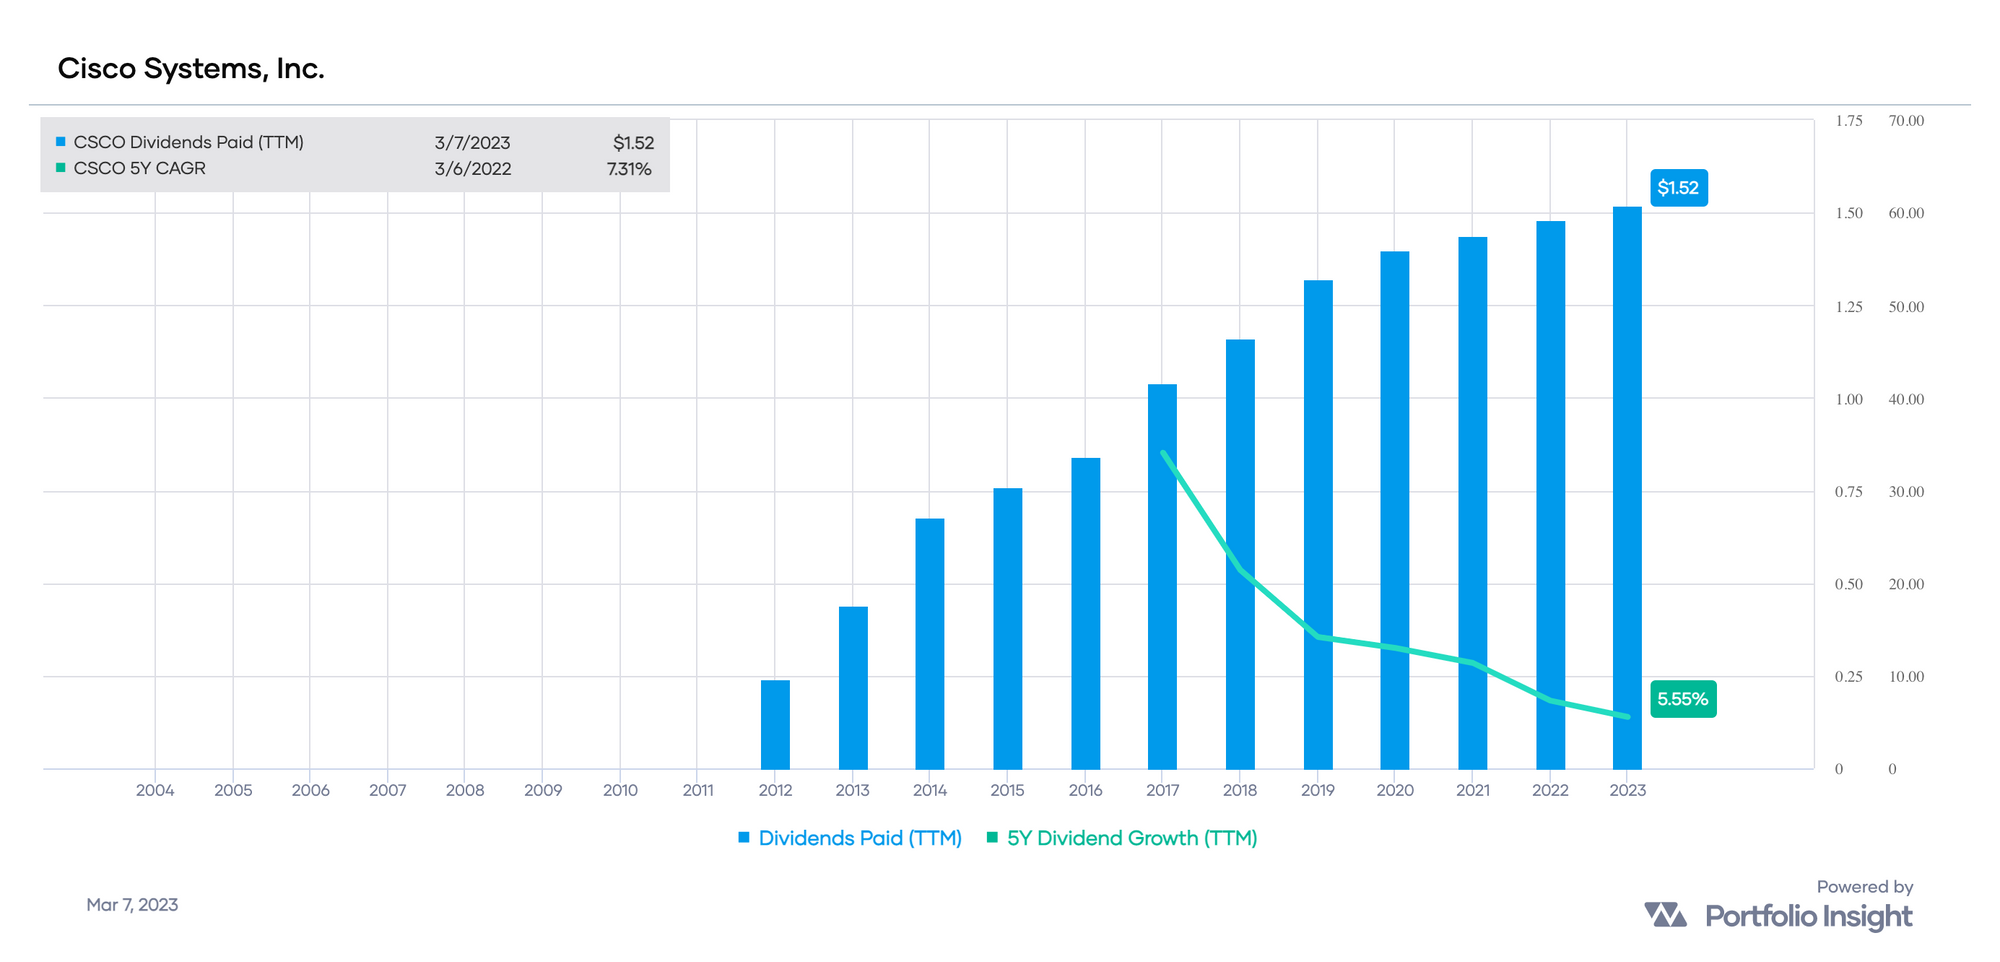
| Year | 2012 | 2013 | 2014 | 2015 | 2016 | 2017 | 2018 | 2019 | 2020 | 2021 | 2022 |
| Dividend | 0.36 | 0.65 | 0.74 | 0.82 | 0.99 | 1.13 | 1.28 | 1.38 | 1.43 | 1.47 | 1.51 |
| 1-year DGR | • | 80.56% | 13.85% | 10.81% | 20.73% | 14.14% | 13.27% | 7.81% | 3.62% | 2.80% | 2.72% |
| 5-year DGR | • | • | • | • | • | 25.71% | 14.51% | 13.27% | 11.76% | 8.23% | 5.97% |
Furthermore, a company with declining earnings can show substantial dividend growth, but such growth would be unsustainable. Sure Dividends present a good example of this scenario:
• A stock’s earnings-per-share fall from $10.00 to $5.00 in 5 years.
• The stock raises its dividend from $1.00 per share to $3.00 per share in 5 years
That's an impressive 5-year DGR of 24.6%, but the underlying business likely is in decline given the deterioration of its earnings over that time frame. The payout ratio expanded from 10% to 60% in five years, "affording" the illusory dividend growth.
The Adjusted Chowder Number
Companies pay dividends from earnings, and earnings depend on revenue.
To sustainably pay and increase dividends year after year, a company must increase its earnings and revenue at growth rates that equal or exceed the dividend growth rate. Expanding the payout ratio can accommodate higher dividend growth rates for several years but not sustainably in the long run.
I define the Adjusted Chowder Number [ACN] as follows:
ACN = min(10%,Y) + min(30%,average(min(D,E,R),median(D,E,R)))
where:
• Y = forward dividend yield
• D = 5-year dividend growth rate
• E = 5-year earnings growth rate
• R = 5-year revenue growth rate
The ACN caps the yield side of the equation to 10% and the growth side of the equation to 30%. Moreover, it averages the minimum and median of the three growth rate metrics.
Below, these growth rate metrics are illustrated for Johnson & Johnson (JNJ).
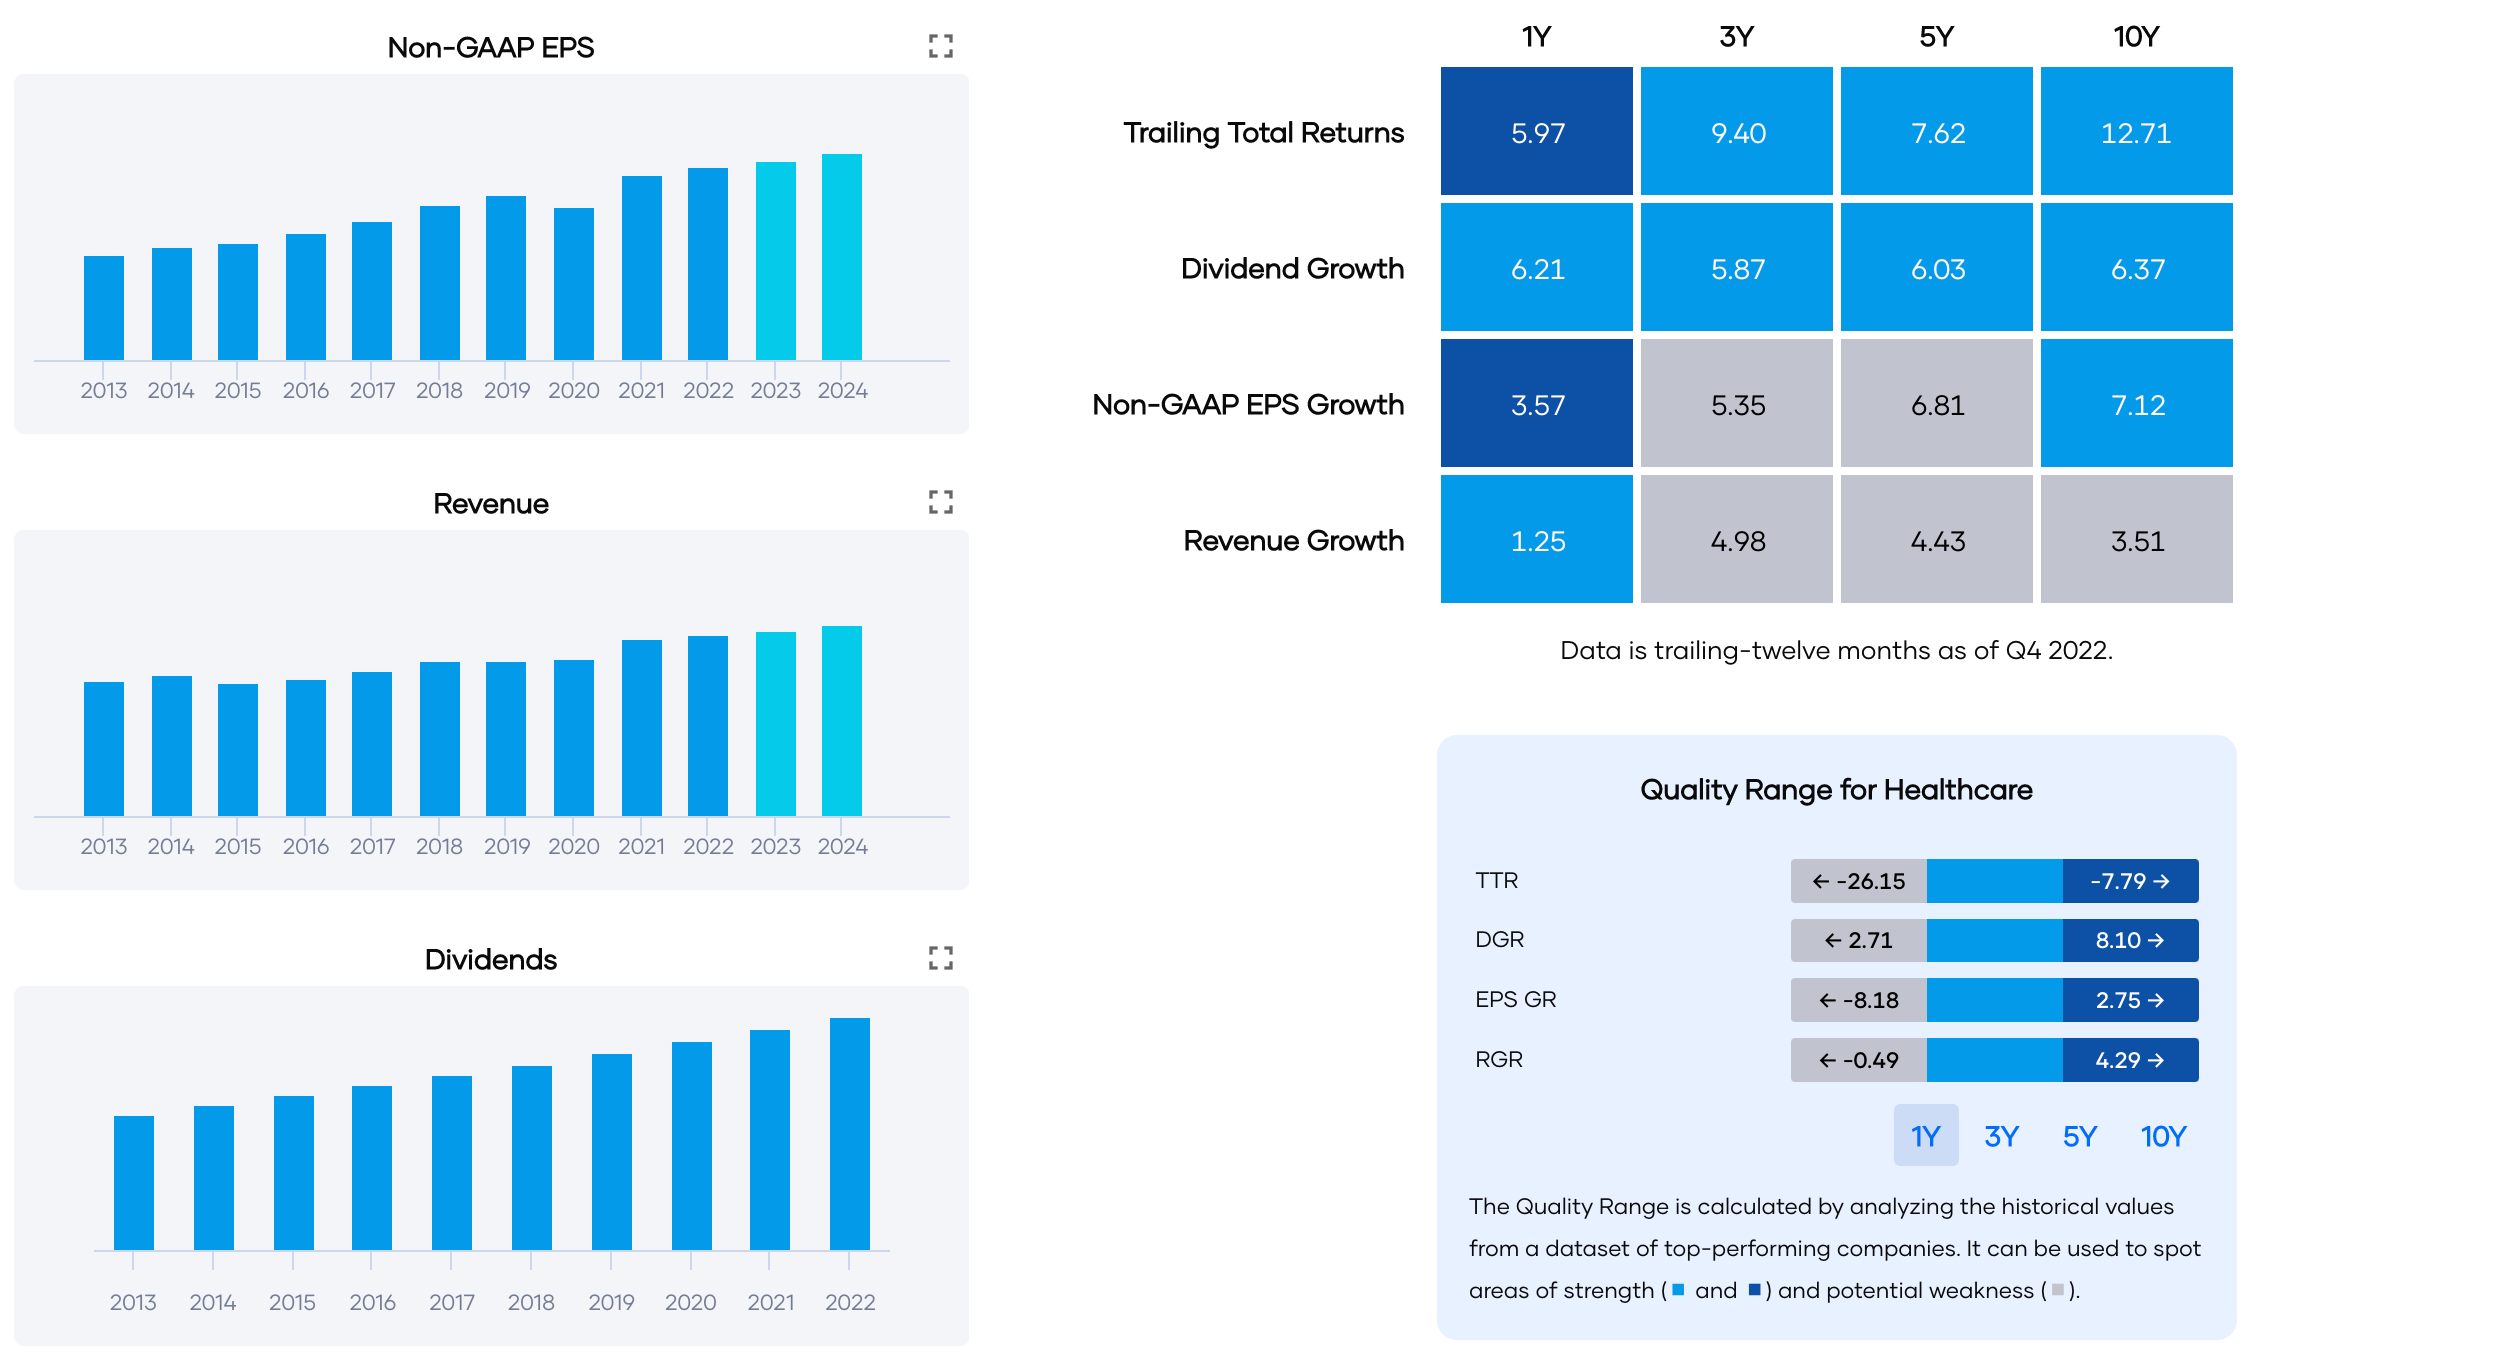
JNJ's 5-year DGR of 6.03% falls within Portfolio Insight's quality range for Health Care stocks. In contrast, the 5-year EPS growth rate [EGR] of 6.81% falls below the quality range for Health Care stocks, as does the 5-year Revenue growth rate of 4.43% [RGR].
JNJ's forward yield is 2.96% at $151.24 per share (as of 9 March 2023).
The Chowder Number [C#] is calculated as follows:
C# = Y + D = 2.96% + 6.03% = 8.99% ≈ 9
The Adjusted Chowder Number [ACN] is calculated as follows:
ACN = min(10%,Y) + min(30%,average(min(D,E,R),median(D,E,R)))
= 2.96% + min(30%,average(4.43%,6.03%))
= 2.96% + 5.23%
= 8.19% ≈ 8
The ACN is a more conservative projection of JNJ's future growth because it accounts for JNJ's lower 5-year RGR.
In cases where the 5-year EGR and 5-year RGR exceed the 5-year DGR, such as with growth stocks and stocks with low payout ratios, the ACN could be higher than the C#. For example, Microsoft (MSFT) is considered a growth stock:
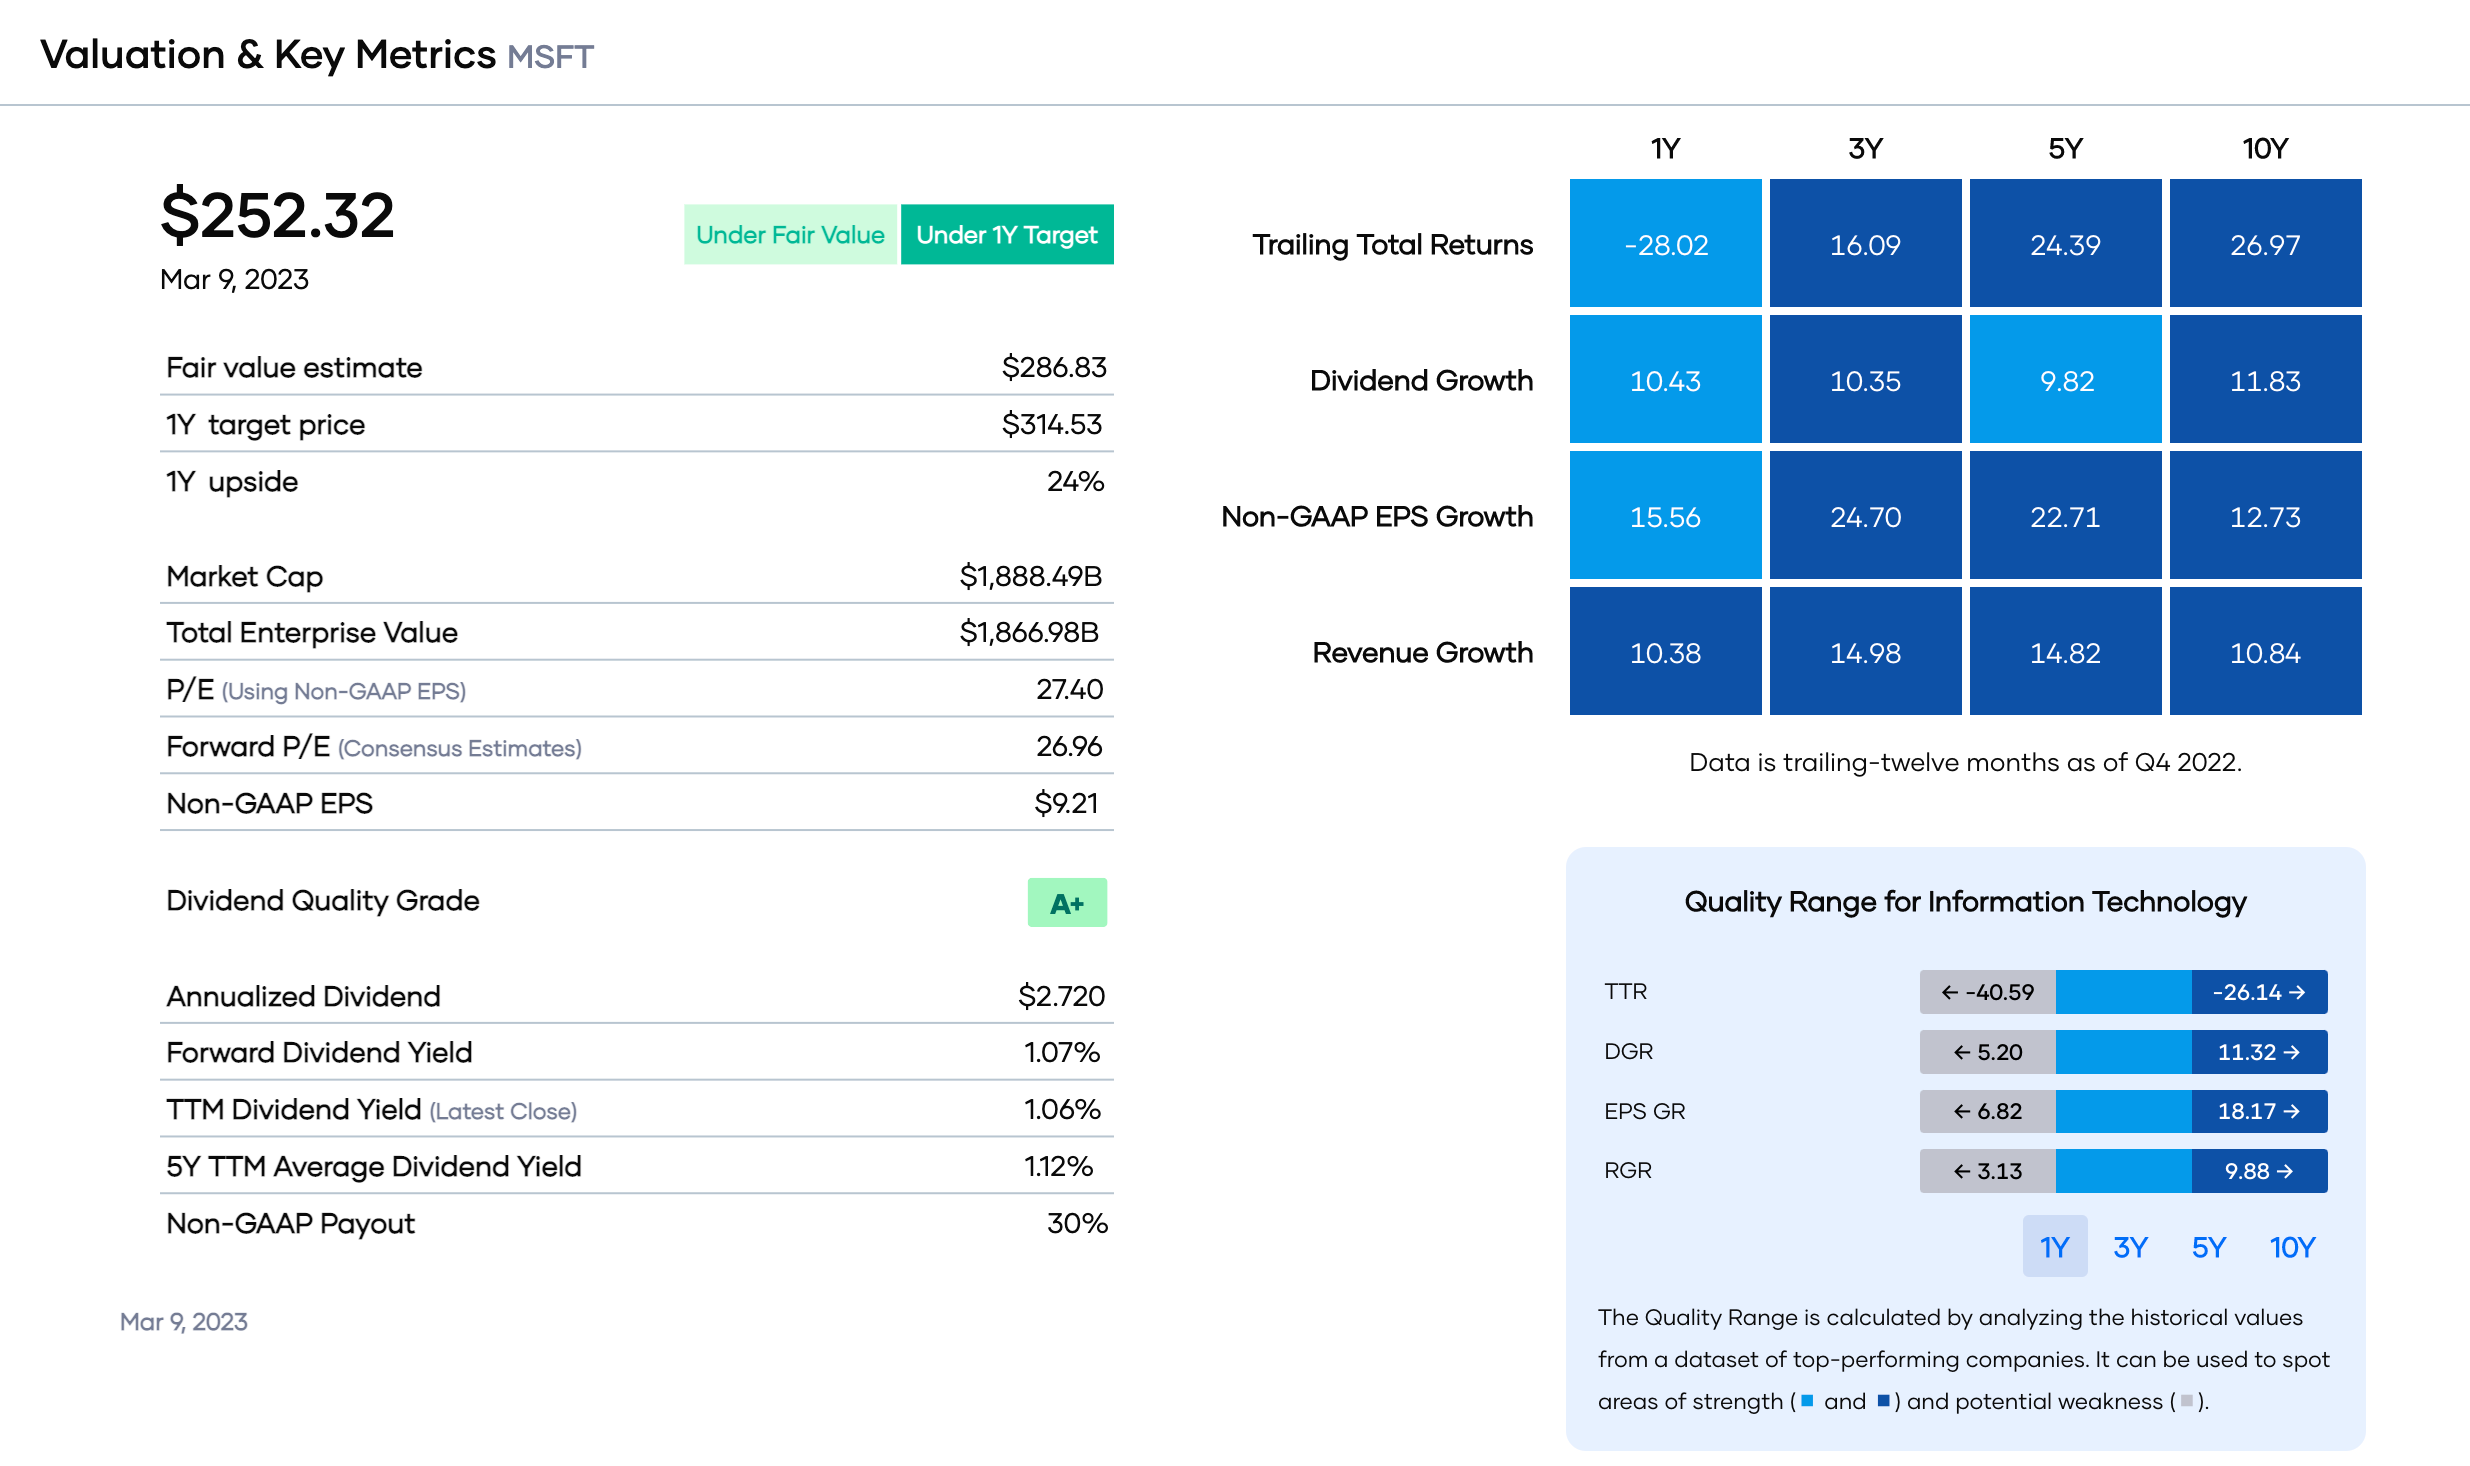
Note MSFT's low payout ratio of 30% and strong 5-year EGR and 5-year RGR, both above the quality range for Information Technology stocks.
Here are the C# and ACN calculations for MSFT:
C# = Y + D = 1.07% + 9.82% = 10.89% ≈ 11
ACN = min(10%,Y) + min(30%,average(min(D,E,R),median(D,E,R)))
= 1.07% + min(30%,average(9.82%,14.82%))
= 1.07% + 12.32%
= 13.39% ≈ 13
The ACN properly accounts for MSFT's higher growth prospects.
In future articles, I'll include the 5-year growth rate metrics and the ACN, color-coded as before. Below is an example of the ten top-ranked Dividend Contenders:
| Rank | Ticker | Yrs | Qual | Fwd Yield | 5-Avg Yield | 5-DGR | 5-EGR | 5-RGR | 5-YOC | ACN | 5-TTR | VL PS | VL FS | MS EM | SP CR | SS DS | PI DQ | Buy Below | –Disc +Prem | Price |
| 1 | MSFT | 21 | 29 | 1.06% | 1.12% | 9.8% | 22.7% | 14.8% | 1.7% | 13 | 24.4% | 276 | –7% | 256.15 | ||||||
| 2 | V | 15 | 29 | 0.81% | 0.63% | 18.0% | 16.6% | 10.0% | 1.3% | 14 | 13.5% | 262 | –15% | 222.90 | ||||||
| 3 | COST | 19 | 29 | 0.74% | 0.80% | 8.4% | 17.9% | 11.7% | 1.1% | 11 | 21.3% | 479 | +2% | 487.31 | ||||||
| 4 | HSY | 14 | 28 | 1.72% | 2.03% | 7.8% | 12.4% | 6.8% | 2.4% | 9 | 17.9% | 228 | +6% | 240.63 | ||||||
| 5 | CSCO | 13 | 28 | 3.09% | 2.91% | 6.0% | 7.1% | 2.0% | 3.4% | 7 | 7.7% | 56 | –12% | 49.22 | ||||||
| 6 | MRK | 13 | 27 | 2.68% | 2.82% | 8.2% | 13.5% | 8.1% | 4.0% | 11 | 18.2% | 117 | –7% | 108.87 | ||||||
| 7 | UNH | 13 | 27 | 1.40% | 1.30% | 17.4% | 17.1% | 10.0% | 2.3% | 15 | 20.9% | 523 | –10% | 470.67 | ||||||
| 8 | ACN | 12 | 27 | 1.69% | 1.34% | 9.7% | 12.9% | 11.5% | 2.7% | 12 | 13.4% | 304 | –13% | 264.83 | ||||||
| 9 | CMCSA | 15 | 27 | 3.01% | 2.16% | 12.0% | 12.1% | 7.4% | 4.3% | 13 | -0.6% | 53 | –32% | 35.84 | ||||||
| 10 | HD | 14 | 27 | 2.59% | 2.23% | 18.1% | 17.5% | 9.3% | 4.0% | 16 | 13.4% | 331 | –11% | 293.14 |
Conclusion
In my view, the Chowder Rule is an effective screen for dividend growth stocks likely to deliver annualized returns of 8%. I introduced the Adjusted Chowder Number [ACN] as an alternative to the Chowder Number. It caps the yield and growth components to 10% and 30%, respectively, and uses three 5-year CAGRs (compound annual growth rates) based on Dividends, Non-GAAP EPS, and Total Revenue, providing a more nuanced projection of future growth.