9F Dividend Quality Scores : Factor 2 – Dividend Track Record
My new quality scoring system for dividend stocks blends qualitative and quantitative measures of quality across nine weighted factors. This article describes Factor 2: Dividend Track Record.

This article is the second in a series presenting 9F Dividend Quality Scores, my new quality scoring system that rates dividend stocks on a 10-point scale across nine weighted factors. Each factor blends qualitative assessments with quantitative metrics.
The first article covered Factor 1: Dividend Safety, which evaluates the near-term risk of a dividend cut. This article covers Factor 2: Dividend Track Record, the historical evidence of what management has actually delivered.
Here are the nine factors that contribute to the quality score of a stock:
- Dividend Safety
- Dividend Track Record
- Financial Strength
- Earnings & Revenue Growth
- Profitability & Earnings Quality
- Risk-Adjusted Returns
- Credit Rating & Capital Structure
- Moat & Competitive Advantage
- Governance & ESG
The quality score is a weighted average of individual factor scores. I'll reveal the factor weights in the last article of this series when I assemble the composite quality score.
The quality score maps to the quality labels and investment grades introduced in the first article:
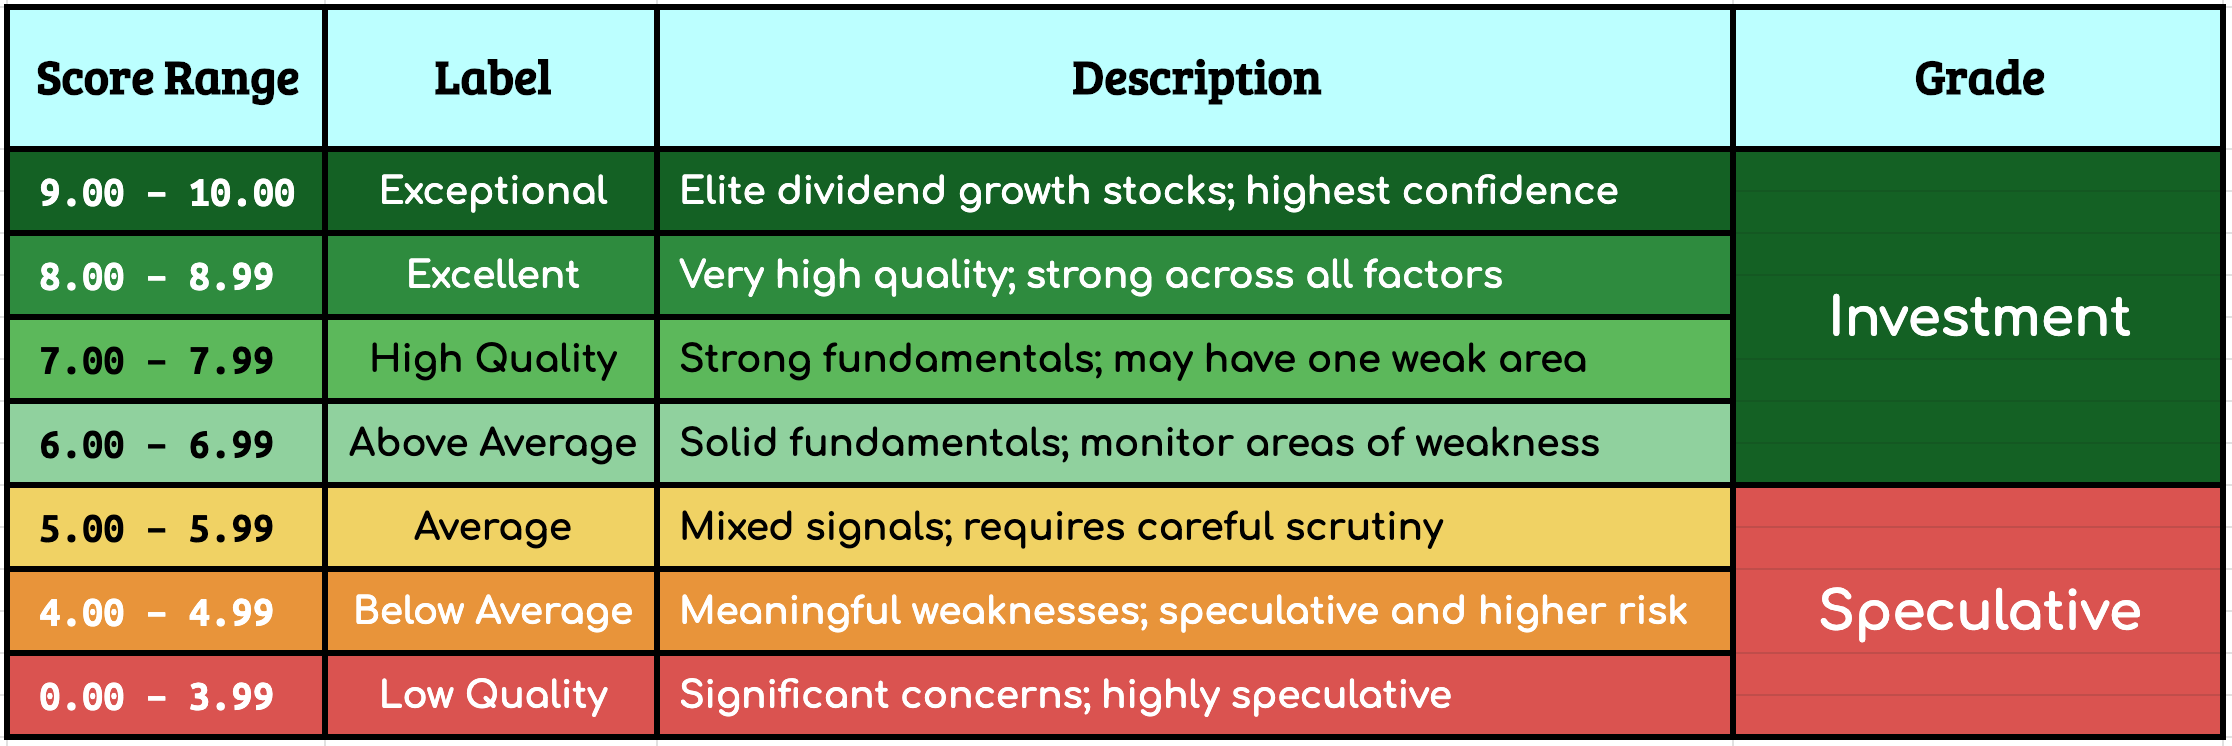
My database now covers 723 dividend stocks across the eleven GICS sectors, down from 727 earlier. Four tickers were pruned in April 2026:
- Due to frozen or cut dividends:
- Cogent Communications Holdings (CCOI)
- Omega Flex (OFLX)
- Southside Bancshares (SBSI)
- Delisted because it was acquired and taken private:
- Air Lease Corporation (AL)
Pruning is a deliberate design choice. When a company's track record collapses, I remove it from my database rather than have it rank at the bottom of the F2 distribution.
Why Dividend Track Record Matters
A multi-decade streak of dividend increases is not luck. It is a testament to a company's unwavering commitment to its shareholders. Maintaining a policy of ever-increasing annual payments requires a rigorous capital discipline that persists even when freezing or cutting the dividend would be the path of least resistance.
Benchmarks such as the Dividend Kings, Dividend Aristocrats, and Dividend Champions serve as proxies for institutional quality. These curated lists filter the broader market into an elite tier of companies defined by durable competitive advantages and rigorous capital discipline. Beyond the metrics, a long track record offers a psychological margin of safety. It signals both a shareholder-centric culture and a business model capable of generating resilient cash flow through every market cycle.
As a dividend growth investor, I distinguish between two critical factors:
- Factor 1: Dividend Safety — The Forward View, which focuses on the future: Does current cash flow support next year's payout and beyond?
- Factor 2: Dividend Track Record — The Historical View, which focuses on execution: What has management actually delivered across decades of volatility?
These factors often diverge. A high-growth newcomer may boast an impeccable safety profile but lack a proven crisis pedigree. Conversely, a legacy payer might possess a legendary streak but reveal warning signs in its current cash flow.
Design Philosophy
To score a dividend growth stock's track record, I balance the tension between longevity and growth. Longevity says a 60-year streak deserves far more credit than a 10-year streak. Growth says a 20-year streak growing at 12% per year is more valuable than a 60-year streak growing at 2% per year.
I also consider the Growth Quality Index (GQI), which assesses whether dividend growth has been earned and can be sustained. GQI aggregates dividend, earnings, and revenue growth and rewards consistency across the three growth rates. In essence, GQI checks if growth is supported.
Buybacks round out the picture. Some companies use cash to pay dividends and buy back their own shares. Buybacks reduce a company's share count, boosting earnings per share and improving dividend coverage. Shareholder yield (dividend yield + buyback yield) provides a more complete picture than focusing solely on dividend yield.
The Metrics I Use
Factor 2 consists of two assessments: a qualitative sub-score (0-3.5 points) based on expert grades and recession behavior, and a quantitative sub-score (0-6.5 points) based on streak length, growth rates, a growth-quality check, and buyback activity. Together they produce a Factor 2 score out of 10 points.
Qualitative Metrics (max 3.5 points)
I use three sources to measure track record quality.
Seeking Alpha [SA] Dividend Growth Grade
Seeking Alpha's quant team grades dividend growth on an A+ to F scale. The grade combines historical dividend growth rates, growth trend persistence, and forward analyst estimates of dividend growth. The forward lean is intentional: it rewards companies whose growth is expected to continue, not just companies with a long rear-view track record.
I give SA the highest weight of 0.55, and map grades internally to a 10-point scale in an intentionally non-linear fashion:
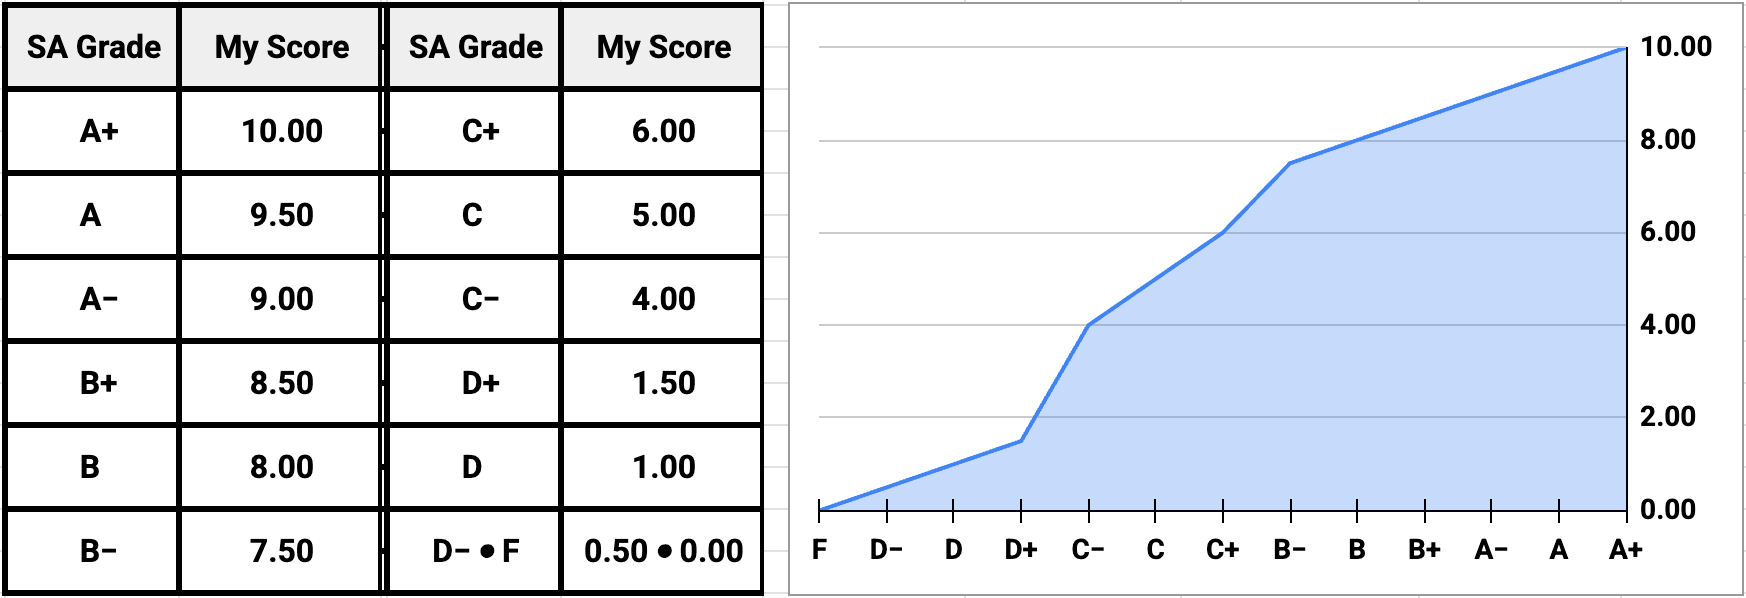
The mapping is compressed at the top and breaks twice, once at B− and again sharply at C−. The latter discontinuity reflects that D grades signal a meaningful concern about dividend growth quality.
Seeking Alpha [SA] Dividend Consistency Grade
This grade measures the consistency of dividend payments, whether the company pays on schedule, every time, and without surprises. Companies can grow their dividends rapidly while having inconsistent payment histories, so consistency is measured separately from growth. I use the same A+ to F scale and internal 10-point scale mapping, but assign a weight of 0.25.
Simply Safe Dividends [SS] Recession Dividend Behavior
Simply Save Dividends uses historical data to assess how well dividends have held up during times of distress. I map the three outcomes as follows:
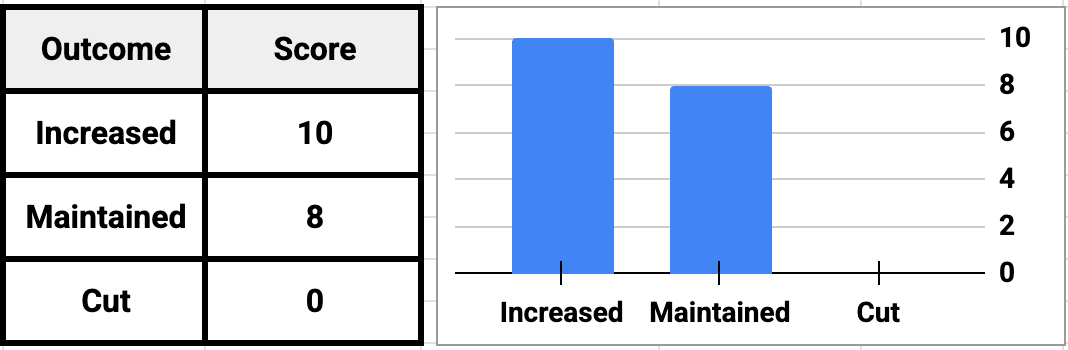
I treat a Maintained dividend as a strong outcome at 8.0, much closer to Increased than to Cut. Holding the line during a recession is a commitment in itself and shows balance-sheet preparedness and management resolve. The weight for this source is 0.20.
How the Qualitative Sources Combine
I compute a weighted average of the scores from available sources and apply a 10% penalty for missing data.
Since each component is scored out of 10 points, I combine them by a weighted average before scaling to the maximum qualitative sub-score of 3.5 points:
qual2 = wavg_10 × (3.5 / 10)
Coverage
Here's the coverage of each source:
- SA Dividend Growth Grade: 647 of 723 tickers (89.5%)
- SA Dividend Consistency Grade: 647 of 723 tickers (89.5%)
- SS Recession Dividend Behavior: 489 of 723 tickers (67.6%)
693 of all tickers (95.9%) are covered by at least one source, so only 30 tickers (4.1%) lack any qualitative assessment. For those tickers, Factor 2 relies entirely on quantitative metrics (presented in the next section).
All three sources cover 443 tickers (61.3%). Those are the tickers that can earn the maximum qualitative sub-score of 3.5 points.
Quantitative Metrics (max 6.5 points)
For all quantitative metrics, I blend absolute and sector-relative scores. In most cases, 70% of the score is based on a piecewise-linear mapping of the metric's actual value. The other 30% is based on the metric's sector percentile. For the streak length, I use a lighter 85/15 blend.
Longevity (Growth Streak, 2.5 points)
The growth streak metric counts consecutive years of dividend increases. I anchor the scoring to the Dividend Kings and Dividend Champions tiers:
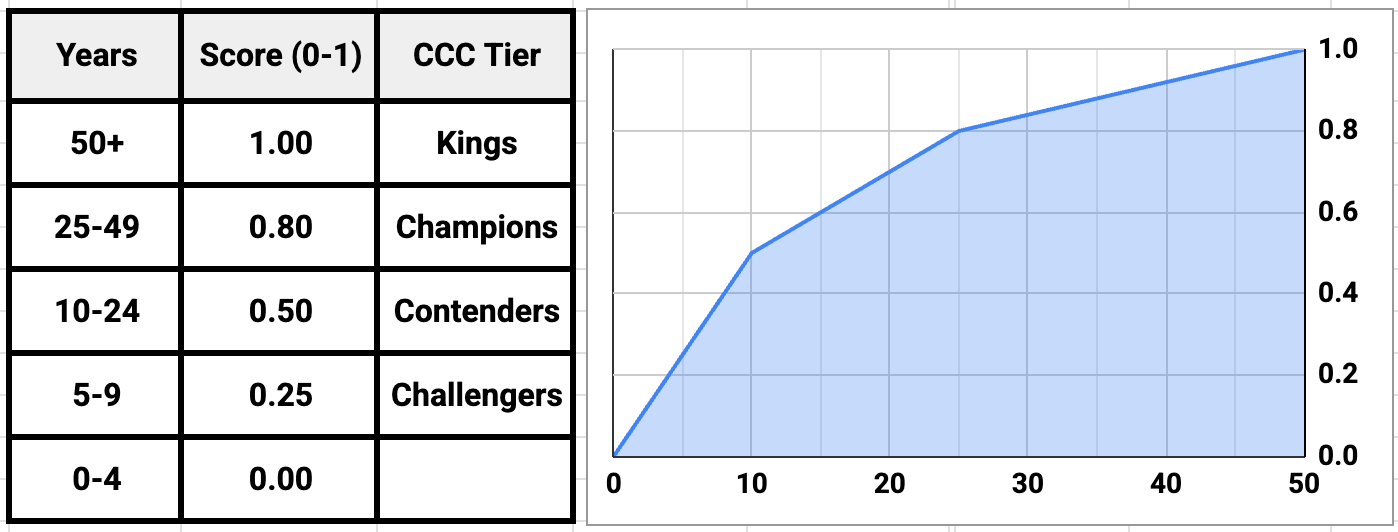
Breakpoints are piecewise linear between anchors, and newer but growing streaks accumulate credit gradually until they become Challengers.
I use an 85/15 sector blend rather than the standard 70/30 blend used elsewhere. The growth streak is partly an absolute achievement regardless of the sector: a 50-year streak in any sector is a 50-year streak. But sector context still matters at the margins. For example, the typical Consumer Staples streak is much longer than the typical Consumer Discretionary streak.
Growth Velocity (Dividend Growth Rate, 1.5 points)
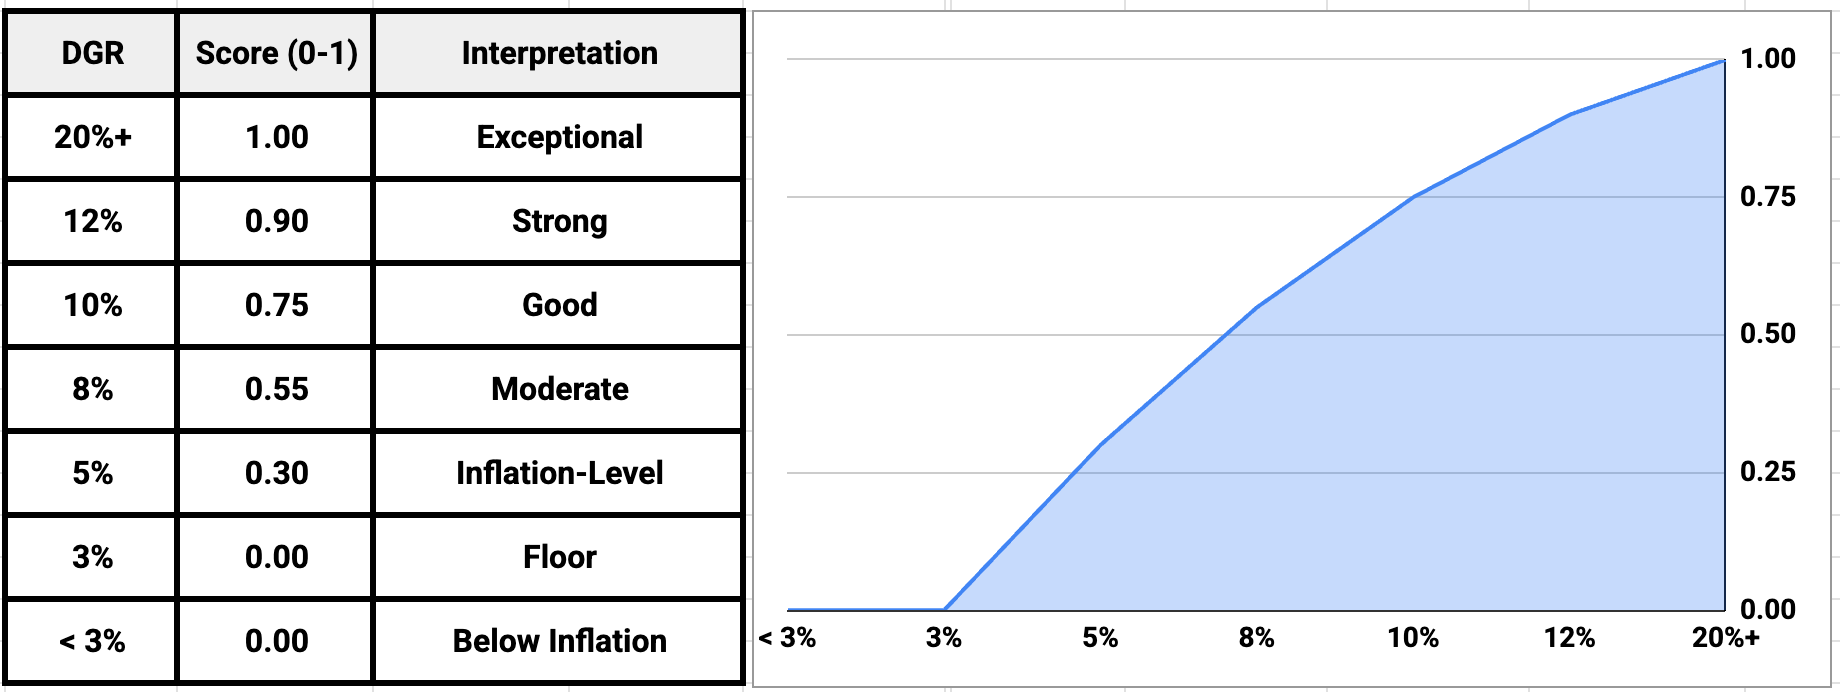
I blend three dividend growth rate [DGR] timeframes:
| Metric | Weight | Sector Blend |
| 5-year DGR | 0.50 | 70/30 |
| 10-year DGR | 0.30 | 70/30 |
| 3-year DGR | 0.20 | Absolute only |
The 3-year DGR uses only absolute scoring because between-sector variance is low for such a short time frame. The 5-year and 10-year DGRs include sector-percentile adjustments: the fast-growing Information Technology sector penalizes a 6% grower relative to its peers, while the Utility sector norms protect a 3% grower.
I use the following growth velocity curve for all three DGR timeframes:
Growth Quality Index (GQI, 2.0 points)
I created the GQI to assess whether dividend growth has been earned and can be sustained by underlying business fundamentals. Companies pay dividends from earnings, and earnings depend on revenue. By considering the 5-year growth rates of all three metrics, we can assess the degree of alignment among them.
GQI = avg(min(D, E, R), median(D, E, R))

Where:

D = 5-year dividend growth rate
E = 5-year earnings growth rate
R = 5-year revenue growth rate
With this formula, I ignore the maximum of the 5-year growth rates and average the lower pair. Using the minimum punishes the weakest leg, while using the median provides some balance. Together, they penalize dividend growth rates that outpace business fundamentals. A company growing dividends at 15% while earnings grow at only 3% will score much lower than one where all three growth rates are aligned.
I use sector-appropriate proxies. REITs report large non-cash depreciation that distorts EPS, so I use AFFO when available. Also, for the Energy sector, I prefer 10-year growth rates because a 5-year window spans only about half of a commodity cycle.
The GQI scoring curve is anchored to the distribution of GQI scores of stocks in my database:
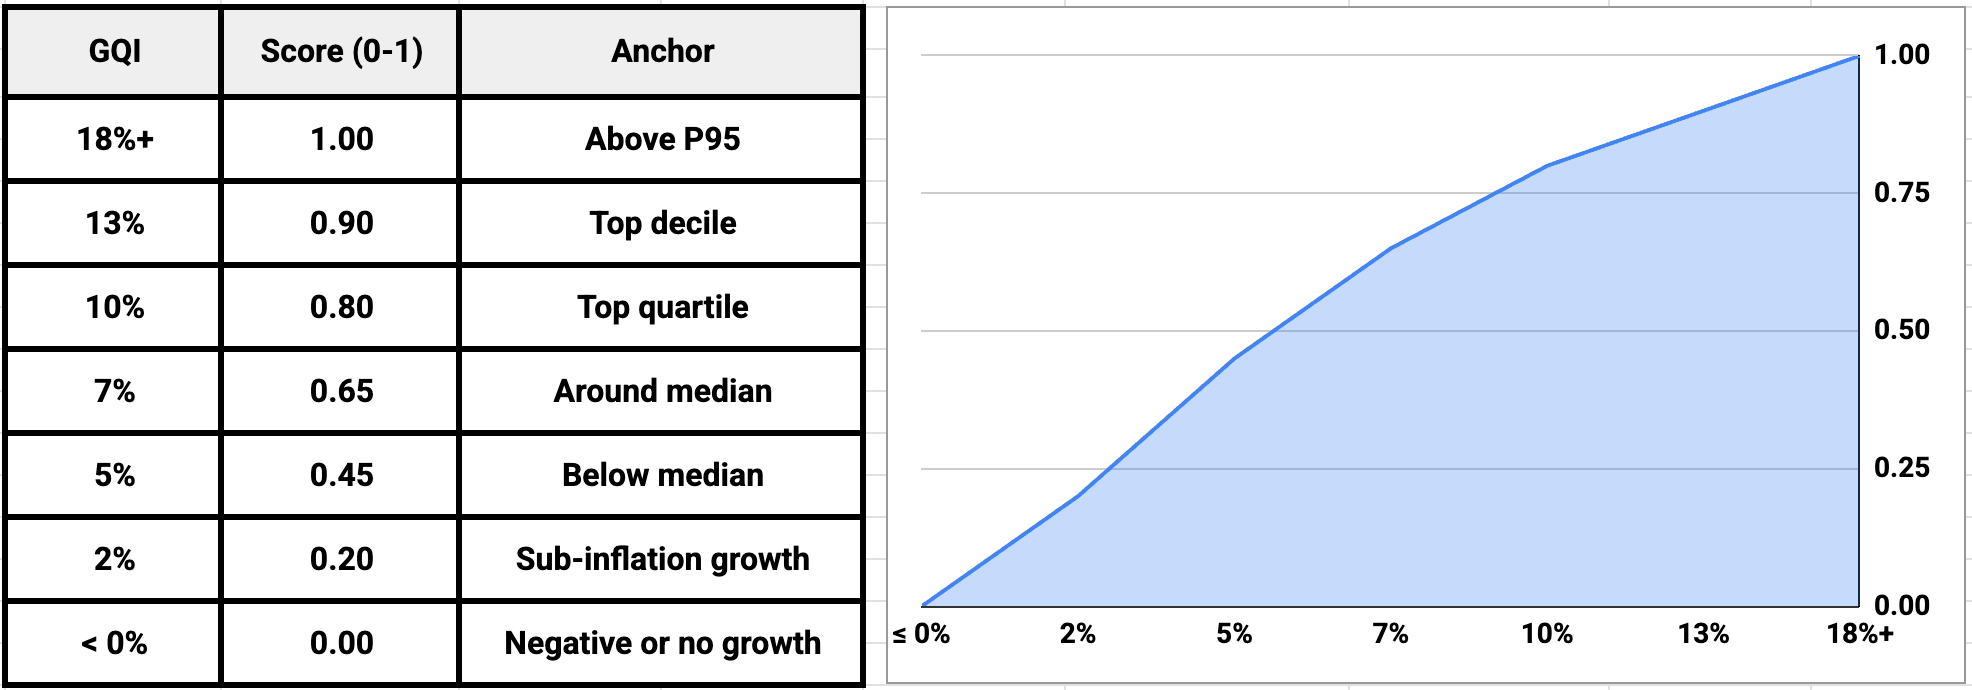
I use a 70/30 blend of absolute GQI scores and their sector percentile counterparts. This adjustment protects slow-growing sectors like Consumer Staples, Communication Services, and Utilities from being held to the same standards as fast-growing sectors like Information Technology and Industrials.
Buyback Integration (Excess Yield, 0.5 points)
I use excess yield to isolate net buyback activity:
The buyback curve has a breakpoint at 0% to penalize dilution:
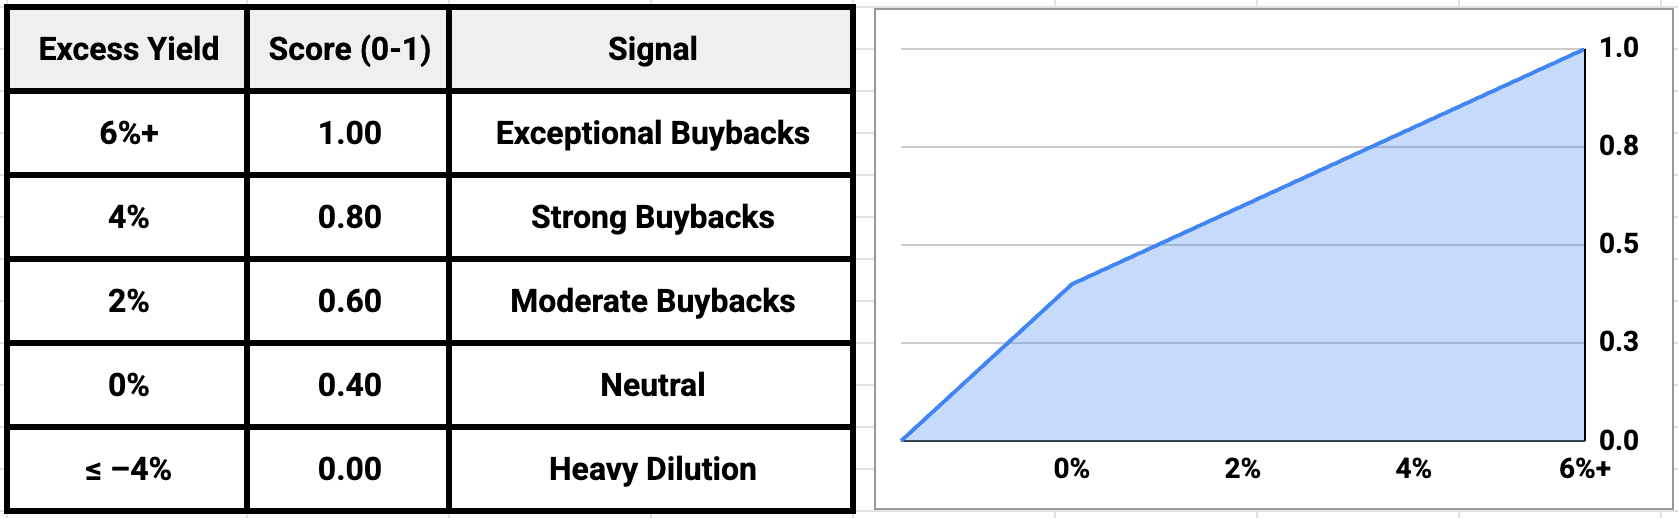
I apply a 70/30 sector blend to prevent REITs and utilities from being penalized too harshly relative to tech companies that have aggressive buyback programs.
REITs and utilities issue new shares rather than buying back shares. Their excess yields routinely run from -5% to -10%. The sector blend partially protects them: a REIT's excess yield is compared to other REITs, not to tech companies.
How the Quantitative Sources Combine
As with the qualitative sources, I apply a 10% penalty for any missing data. Then I sum the component scores to get the final score out of 6.5 points:
Combining the Sub-Scores
When both sub-scores are available, they sum directly:
- qual2 (0-3.5) + quant2 (0-6.5) = Factor 2 score ranging from 0 to 10.
In rare cases where only one sub-score is available, I apply a 5% penalty.
30 of the 723 tickers (4.15%) have only quantitative sub-scores. None has only qualitative sub-scores.
Finally, I calculate a factor confidence score: conf2 = number of metrics ÷ 11, because Factor 2 relies on eleven different grades and metrics.
Results: How the Scores Look
Let's now look at how the Factor 2 scores look for the 723 stocks in my database.
Distribution
Here is a chart showing the distribution of Factor 2 scores:
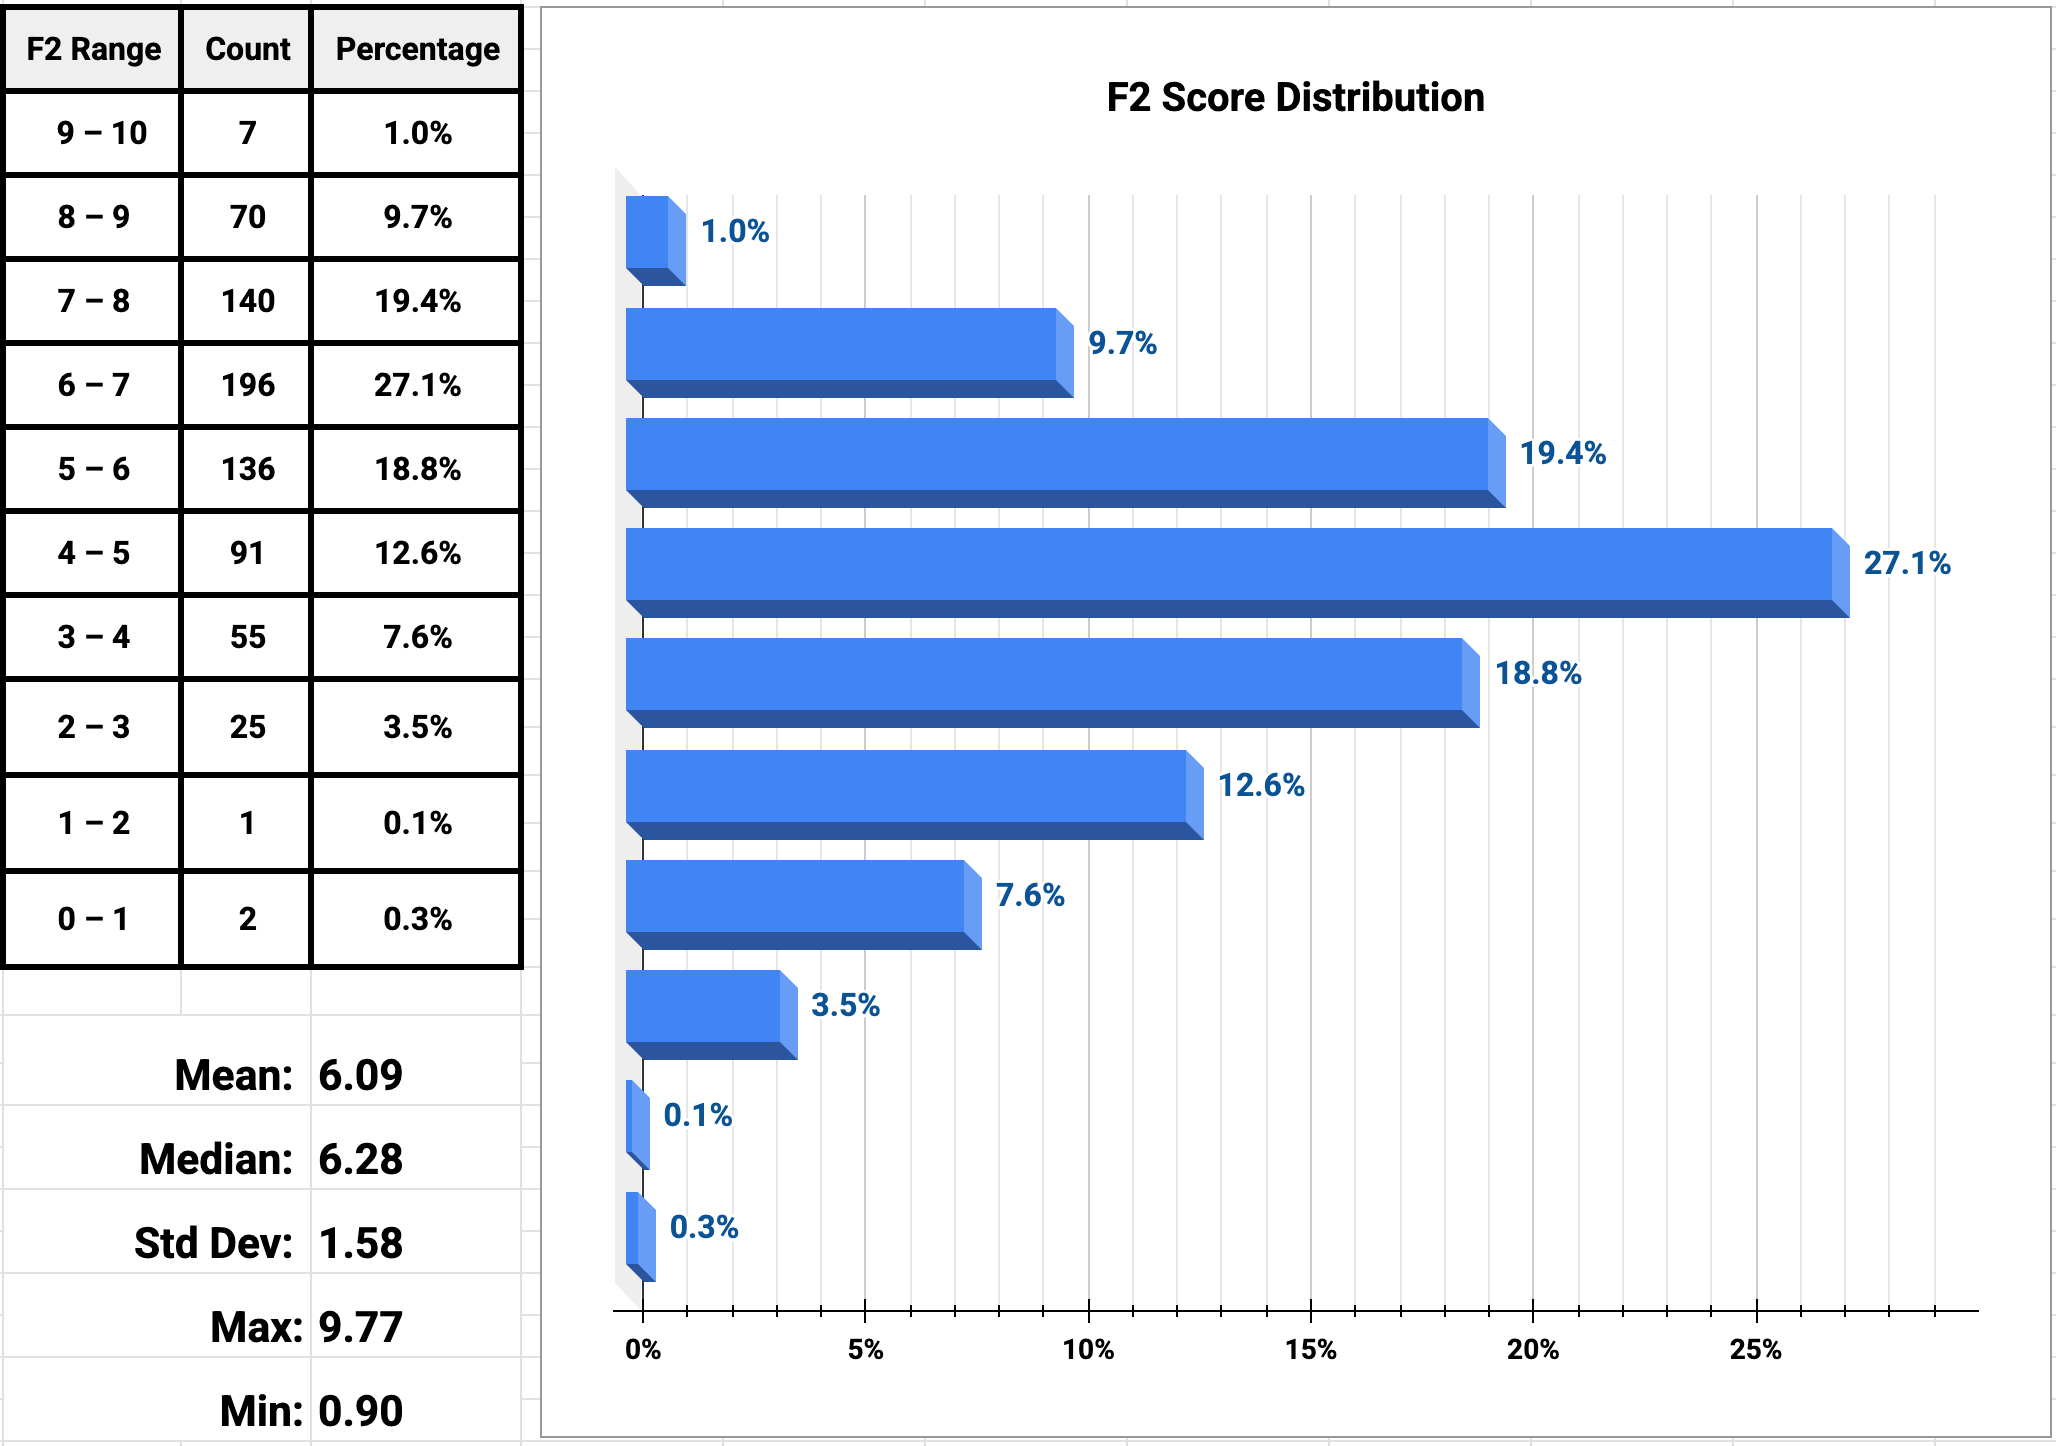
The distribution is slightly skewed to the high side with the median above the mean. The shape has a fatter mid-range (5-8 contains 65% of the universe), which makes sense for a dividend-growth-curated universe where most names have at least some track record.
Sector Leaders
Here are the highest Factor 2 scores in each GICS sector, with a breakdown of how they scored:
| Sector | Ticker | F2 | Qual | Quant | Streak | 5-year DGR |
GQI | Excess Yield |
SA Growth |
SA Consist. |
Recession |
| Comm. Services | CMCSA | 7.18 | 3.22 | 3.96 | 18 | 7.50% | 5.6 | 0.91% | N/A | N/A | Increased |
| Cons. Discret. | WSM | 8.68 | 3.27 | 5.41 | 21 | 20.88% | 9.2 | 3.40% | A+ | A- | Maintained |
| Cons. Staples | COST | 8.87 | 3.41 | 5.46 | 22 | 12.89% | 11.4 | 0.18% | A+ | A- | Increased |
| Energy | TPL | 8.88 | 3.46 | 5.42 | 20 | 11.20% | 18.7 | -0.04% | A+ | A | Increased |
| Financials | V | 9.01 | 3.41 | 5.60 | 18 | 14.90% | 14.5 | 2.89% | A+ | A- | Increased |
| Health Care | NVO | 8.52 | 3.26 | 5.26 | 18 | 20.80% | 20.1 | -2.21% | A- | A | Increased |
| Industrials | CTAS | 9.77 | 3.50 | 6.27 | 43 | 19.60% | 13.3 | 1.50% | A+ | A+ | Increased |
| Info. Tech. | BMI | 9.44 | 3.36 | 6.08 | 33 | 16.20% | 15.9 | 1.02% | A | A | Increased |
| Materials | SHW | 8.69 | 3.40 | 5.29 | 48 | 12.08% | 6.0 | 1.04% | A | A+ | Increased |
| Real Estate | TRNO | 8.16 | 3.14 | 5.02 | 15 | 12.50% | 12.0 | -5.58% | A- | A | N/A |
| Utilities | ATO | 8.45 | 3.21 | 5.24 | 42 | 8.67% | 8.7 | -6.29% | B+ | A+ | Increased |
A few observations:
- No sector leader hits a perfect 10. CTAS is the top scorer among the sector leaders, but it has a modest excess yield of 1.5%, so its buyback score of 0.275 out of 0.5 is responsible for the 0.225 gap.
- Industrials and Information Technology lead the sector leaders. CTAS and BMI are both Dividend Champions with strong 5-year DGRs and supportive GQIs. The Industrials sector in particular is home to Dividend Kings and fast-growing Dividend Champions.
- SHW is the Materials sector leader despite its low GQI score. While SHW is close to becoming a Dividend King, its GQI of 6.0 is the lowest in the table. Nevertheless, its GQI is well above the sector median, so the sector percentile blend raises SHW's score to a respectable level.
- Real Estate's leader (TRNO) uses the AFFO substitution in its GQI. This materially improves TRNO's score. Its excess yield of -5.58% is structural REIT behavior. The sector percentile blend explains how a stock with a negative excess yield still clears 8.0.
- Energy's leader (TPL) benefits from the 10-year EPS/Revenue substitution. With 26.28% earnings growth and 27.18% revenue growth over the longer window, its GQI of 18.7 is the highest in the table and saturates the absolute curve.
- The Utilities sector leader (ATO) scores higher than AWR because its GQI is higher. Even though AWR has a longer streak than ATO (71 years vs 42 years), ATO's GQI of 8.7 is well above AWR's 6.9.
| CTAS | Cintas | BMI | Badger Meter | SHW | Sherwin-Williams | TRNO | Terreno Realty |
| TPL | Texas Pacific Land | ATO | Atmos Energy | AWR | American States Water |
Profile-Spanning Examples
Let's consider another view, this time focused on the trade-offs between different scoring axes:
| Ticker | F2 | Qual | Quant | Streak | 5-year DGR |
GQI | Excess Yield |
SA Growth |
SA Consist. |
Profile |
| PH | 9.60 | 3.50 | 6.10 | 69 | 14.27% | 11.5 | 1.74% | A+ | A+ | King + velocity |
| ADP | 8.94 | 3.11 | 5.82 | 50 | 11.31% | 9.5 | 1.44% | B | A+ | Recent King, strong quant |
| CSL | 9.67 | 3.40 | 6.26 | 49 | 15.42% | 10.1 | 7.47% | A | A+ | Champion + buybacks |
| MSFT | 8.64 | 3.32 | 5.32 | 24 | 10.21% | 12.5 | 0.60% | A+ | A | New streak, fast growth |
| V | 9.01 | 3.41 | 5.60 | 18 | 14.90% | 14.5 | 2.89% | A+ | A- | Short streak, elite all |
| TRNO | 8.16 | 3.14 | 5.02 | 15 | 12.50% | 12.0 | -5.58% | A- | A | REIT, AFFO-based GQI |
| AFL | 7.62 | 3.21 | 4.41 | 44 | 15.44% | -0.1 | 4.63% | B+ | A+ | Long streak, weak GQI |
| TGT | 6.44 | 2.73 | 3.71 | 58 | 11.01% | 0.5 | 0.08% | C+ | A+ | King, unsupported DGR |
| OC | 8.17 | 2.81 | 5.36 | 13 | 23.90% | 12.9 | 6.13% | B+ | B- | New streak, big buybacks |
| AWR | 8.43 | 3.31 | 5.12 | 71 | 8.66% | 6.9 | -2.27% | A- | A+ | Longest streak, slow |
A few observations:
- Although AWR has the longest streak in the table at 71 years, it scores below V with its streak of only 18 years. The reason is growth velocity. V's 5-year DGR and GQI dominate AWR's counterparts. The system rewards a fast-growing 18-year streak more than a slow-growing 71-year streak.
- AFL has a 44-year streak and a 5-year DGR of 15.44%, but its GQI is negative (-0.1). AFL's revenue growth has been negative, so its high 5-year DGR is deemed to be unearned.
- TGT tells a similar story. It's a Dividend King with a 58-year streak and a 5-year DGR of 11.01%. But TGT's earnings growth of -1.21% and revenue growth of 2.29% show that underlying business fundamentals do not support the stock's dividend growth.
- OC demonstrates how meaningful the buyback contribution can be. With its modest 13-year streak, OC reaches an F2 score of 8.17, partly because its aggressive buybacks result in a near-maximum buyback score. A high GQI score also contributes significantly.
- CSL will soon be a Dividend King. Its 49-year streak, 7.47% excess yield, and growth quality (GQI of 10.1) all contribute to a very high F2 score of 9.67.
| AWR | American States Water | V | Visa | AFL | Aflac | TGT | Target | OC | Owens Corning |
| CSL | Carlisle |
What's Next
My next article will cover Factor 3: Financial Strength, which asks whether a business can sustain its dividend payments and growth. Factor 3 examines the underlying balance sheet, including leverage, coverage, liquidity, and bankruptcy risk.